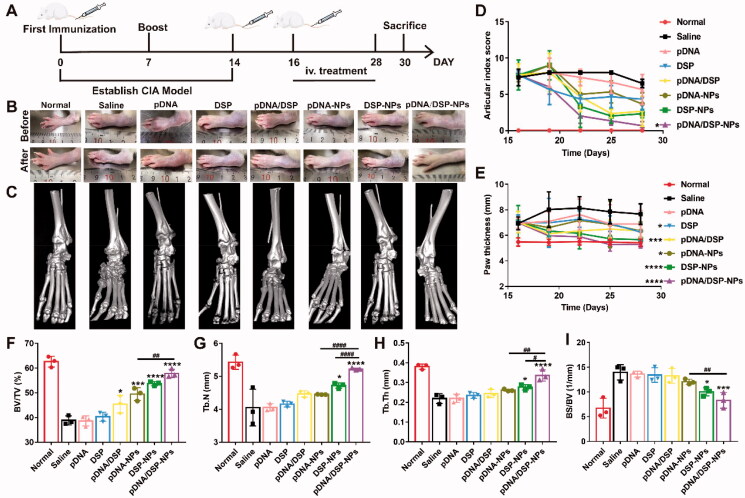
Figure 5.
In vivo therapeutic efficacy evaluation. (A) Schematic depicting the experimental procedure of arthritis induction and intravenous treatment with NPs in rats. Photographs (B) and micro-CT images (C) representative hind legs after treatment in different treatment groups. Quantification of articular index score (D), paw thickness (E) after different treatments over time. Quantitative analysis of bone volume over total volume ratio (BV/TV) (F), trabecular number (Tb.N) (G), trabecular thickness (Tb.Th) (H), and ratio of bone surface area to bone volume (BS/BV) (I) of CIA rats in different treated groups. Results were presented as mean ± SD (n = 3). *p < .05, ***p < .001, ****p < .0001 vs saline. #p < .05, ##p < 0.01, and ####p < 0.0001, pDNA-NPs or DSP-NPs vs pDNA/DSP-NPs (two-tailed unpaired Student’s t-test).

