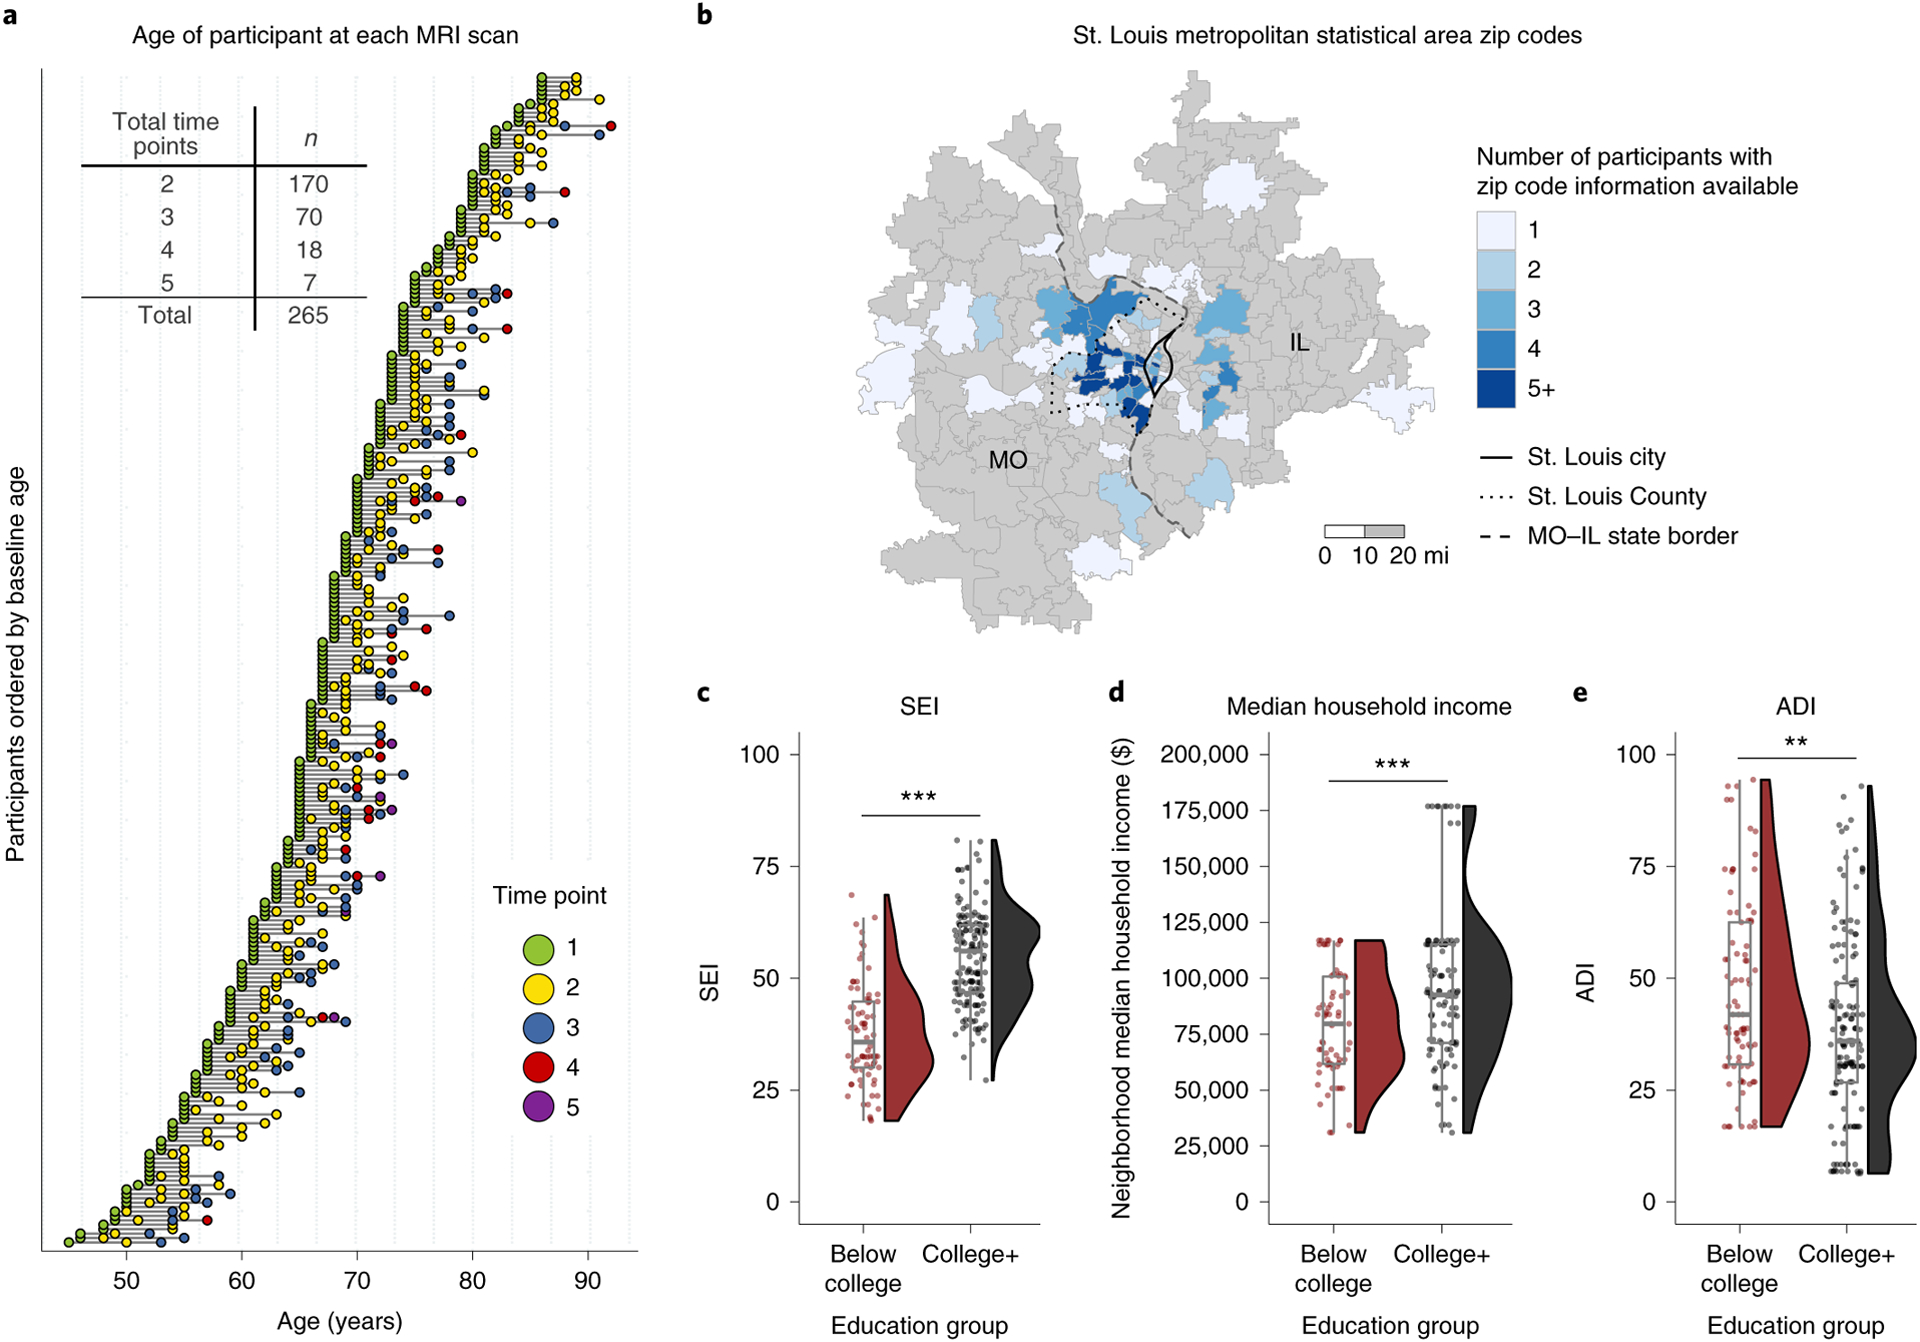
Fig. 1. Longitudinal MRI sessions and geographical and SES-related information of participants.

a, Every participant had at least two MRI (including resting-state) scan sessions, with 36% of participants having three to five separate sessions over multiple years (maximum range, 9.2 years). b, Number of participants from zip codes within the St. Louis metropolitan statistical area. The border of the city of St. Louis (solid), the county of St. Louis (dotted) and the state border between Missouri (MO) and Illinois (IL; dashed) are also depicted. c, Participants with a college degree have higher socioeconomic index (SEI) (data are available for 86% (n = 228) of participants; t132 = −10.791, P < 0.001, Cohen’s d = 1.552, 95% confidence interval (CI95%) = (−20.122, −13.888)) and d, live in areas (calculated using participants’ zip codes) with higher neighborhood median household income (data available for 65% (n = 171) of participants; t168 = −3.455, P < 0.001, d = −0.520, CI95% (−24,169.742, −6,591.3510); see text for additional comments about outlier observations) and e, lower scores on the area deprivation index (ADI), an index that combines multiple environmental variables to characterize area deprivation (data available for 89% (n = 236) of participants; t170 = 3.197, P = 0.002, d = 0.435, CI95% = (3.417, 14.443)). Each box plot depicts the median (center line) and first and third quartiles (bounds of box), and whiskers extend to 1.5 times the interquartile range. The whisker does not extend to the minimum and maximum of the data, as individual data points are also plotted. Two-sided Welch’s two-sample t-tests were performed for c–e (significance is denoted in c–e with asterisks: **P < 0.01, ***P < 0.001).
