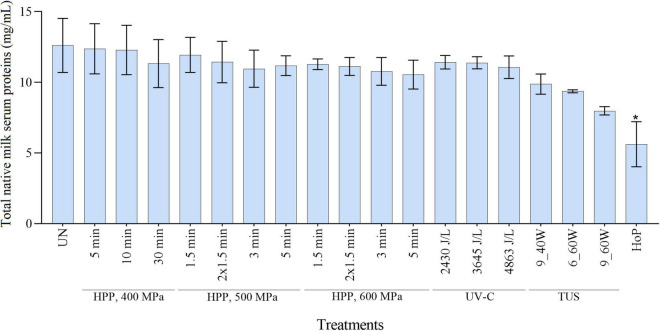
FIGURE 2.
Native milk serum protein concentration as determined with a BCA assay. The results are presented as mean ± standard deviation of two independent experiments and all analyses were performed in technical duplicate. UN represents the untreated values. *Indicates significant differences to untreated samples (p < 0.05).

