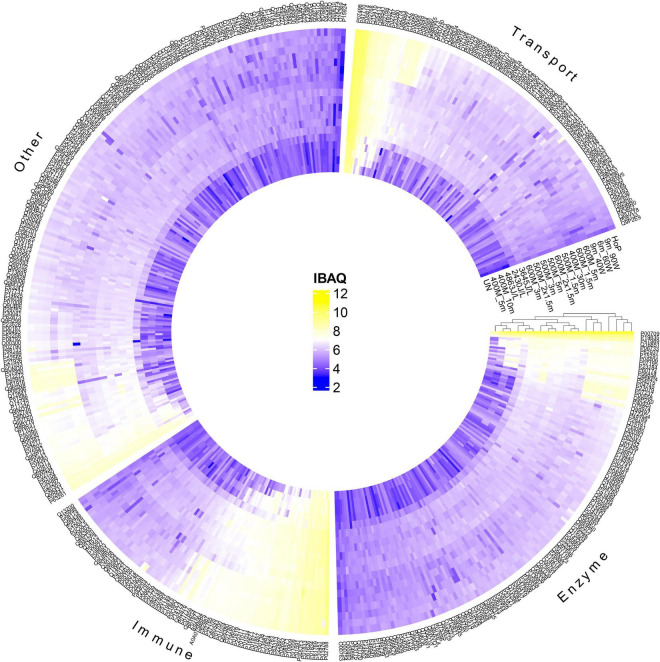
FIGURE 3.
Hierarchical cluster analysis and heatmap showing the changes in the protein profile after HPP, UV-C, TUS, and HoP, based on iBAQ values (log10 scale from 2 to 12 according to color bar). Proteins are labeled by their UniProt ID. Functional categories (enzyme, immune, transport, and other) were based on GO annotation of biological function. Two independent experiments (biological replicates) were performed while all analyses were performed in technical duplicate for each sample. UN represents the untreated values. HPP; 400 MPa for 5, 10, and 30 min, 500 MPa for 1.5, 2 × 1.5, 3, and 5 min, 600 MPa for 1.5, 2 × 1.5, 3, and 5 min, UV-C; 2430J/L, 3645J/L, and 4863L/L,TUS; 9_40W, 6_60W, and 9_60W.

