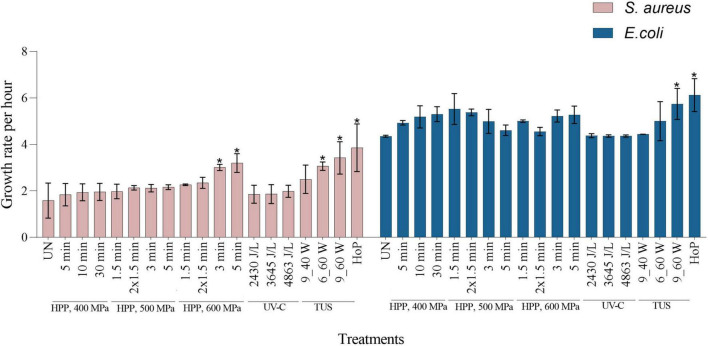
FIGURE 6.
Growth rate per hour of S. aureus and E. coli in untreated, HPP, UV-C, TUS, and HoP DHM samples. The results are presented as mean ± standard deviation of two independent experiments and all analyses were performed in technical duplicate. UN represents the untreated values. *Indicates significant differences to untreated samples (p < 0.05).

