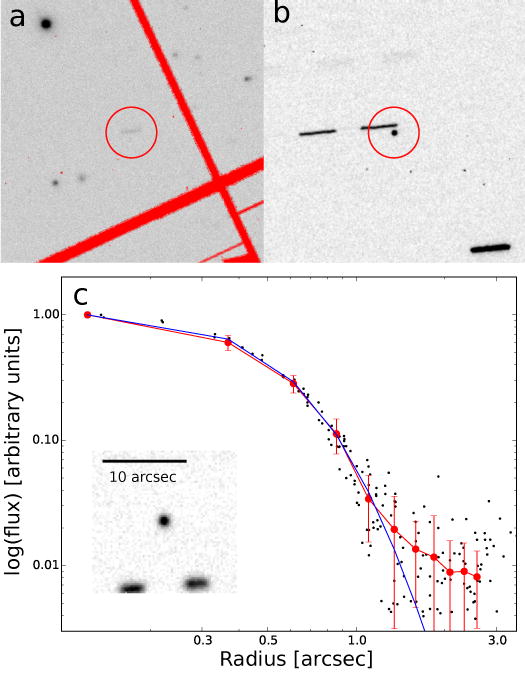
Figure 1. ‘Oumuamua’s Asteroidal appearance.

[a] Pan-STARRS1 discovery image of ‘Oumuamua on 2017 October 19. ‘Oumuamua is the faint trail centered in the circle. Red regions are masked pixels. [b] CFHT image obtained on October 22 showing no hint of coma. [c] Deep image combining Gemini and VLT g and r-band data. The black dots mark the flux in individual pixels. The red dots show the average flux in annuli at each radius (the error bars are the RMS dispersion) and the blue line is a Moffat profile with a FWHM of 0.87″. The difference between the two curves provides a very sensitive upper limit to any possible activity.
