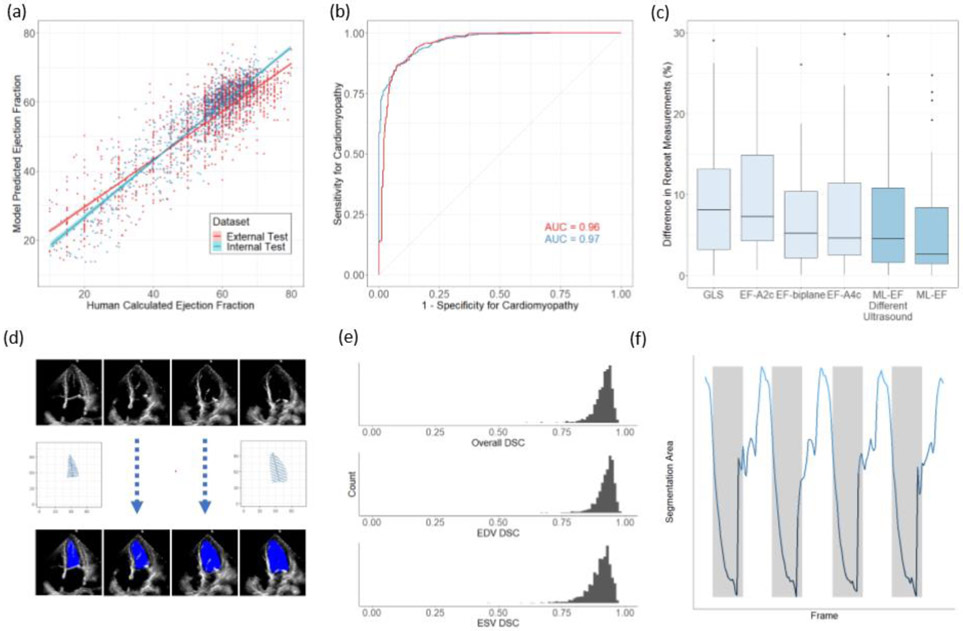
Figure 2. Model Performance.
(a) EchoNet-Dynamic’s predicted EF vs. reported EF on the internal test dataset from Stanford (blue, n = 1,277) and the external test dataset from Cedars-Sinai (red, n = 2,895). The blue and red lines indicate the least-squares regression line between model prediction and human calculated EF. (b) Receiver operating characteristic curves for diagnosis of heart failure with reduced ejection fraction on internal test dataset (blue, n = 1,277) and external test dataset (red, n = 2,895). (c) Variance of metrics of cardiac function on repeat measurement. The first four boxplots highlights clinician variation using different techniques (n=55), and the last two boxplots show EchoNet-Dynamic’s variance on input images from standard ultrasound machines (n=55) and an ultrasound machine not previously seen by the model (n=49). Boxplot represents the median as a thick line, 25th and 75th percentiles as upper and lower bounds of the box, and individual points for instances greater than 1.5 times the interquartile range from the median. (d) Weak supervision with human expert tracings of the left ventricle at end-systole (ESV) and end-diastole (EDV) is used to train a semantic segmentation model with input video frames throughout the cardiac cycle. (e) Dice Similarity Coefficient (DSC) was calculated for each ESV/EDV frame (n = 1,277). (f) The area of the left ventricle segmentation was used to identify heart rate and bin clips for beat-to-beat evaluation of EF.

