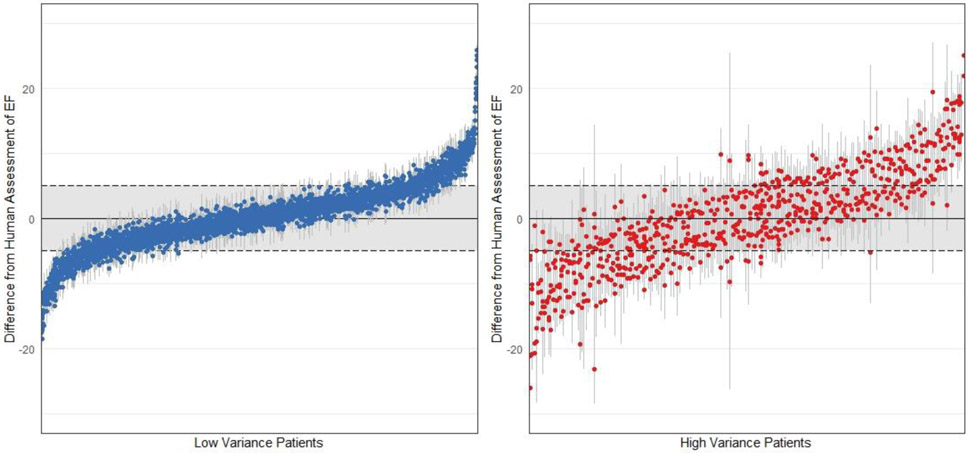
Extended Data Figure 2: Individual beat assessment of ejection fraction for each clip in the test dataset.
The left panel shows patients with low variance across beats (SD < 2.5, n = 3,353) and the right panel shows patients with high variance across beats (SD > 2.5, n = 717). Each patient video is represented by multiple points representing the estimate of each beat and a line signifying 1.96 standard deviations from the mean. A greater proportion of beats are within 5% of ejection fraction from the human estimate (the shaded regions) in videos with low variance compared to individual beat assessment of ejection fraction in high variance patients.

