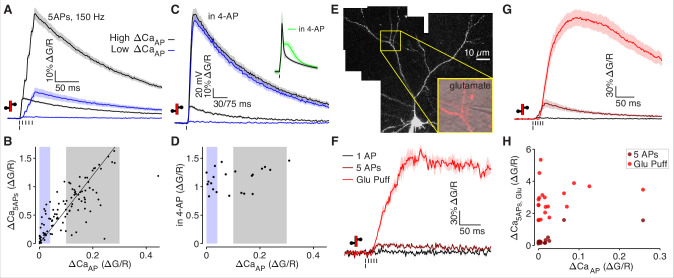
Figure 3. Low ΔCaAP dendrites contain voltage-gated calcium channels.
(A) Calcium-dependent fluorescence transients evoked by 1 bAP or 5 bAPs at 150 Hz in high (black) and low (blue) ΔCaAP dendrites. (B) Comparison of peak calcium influx evoked by 1 bAP or 5 bAPs in each dendrite. Gray and blue patches indicate selection of high (gray) and low (blue) ΔCaAP spines used in panel A. The line y = 6 x is plotted for reference. N = 109/33/9, R2 = 0.609, F = 166, p = 1.5 × 10⁻²³.(C) Calcium-dependent fluorescence transients evoked by 1 bAP before and after application of 2 mM 4-AP in high (black) and low (blue) ΔCaAP branches. Inset: average AP waveform before and after application of 4-AP. (D) Comparison of peak calcium influx evoked by 1 bAP before and after application of 2 mM 4-AP. Gray and blue patches indicate selection of high (gray) and low (blue) ΔCaAP spines used in panel C. There was no significant correlation: N = 22/7/3, R2 = 0.135, F = 3.11, p = 0.093. (E) Maximum z-projection of Alexa 594 fluorescence from a L2/3 pyramidal cell with differential-interference contrast image overlaid showing glutamate puffing pipette. The full apical dendritic morphology was not imaged. (F) Calcium-dependent fluorescence transients evoked by 1 bAP, 5 bAPs at 150 Hz, and a 1 mM glutamate puff in the example branch from panel E. (G) Average calcium-dependent fluorescence transients evoked by 1 bAP, 5 bAPs at 150 Hz, and a 1 mM glutamate puff across all branches recorded. (H) Comparison of peak calcium influx evoked by bAP, 5 bAPs at 150 Hz, and a 1 mM glutamate puff in all branches. The response to 5 bAPs was not recorded in all dendrites (N = 20/6/3).


