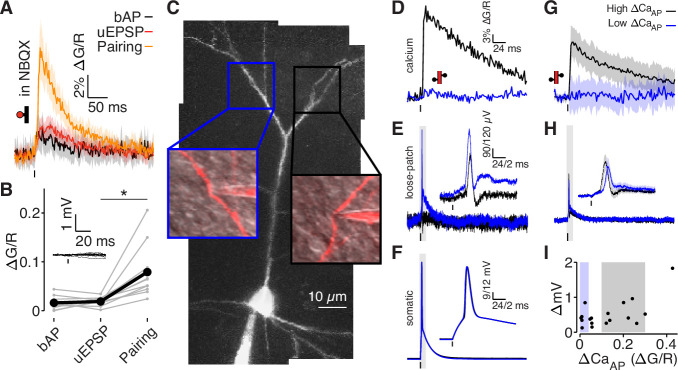
Figure 4. bAPs propagate to low ΔCaAP dendrites in the absence of EPSPs.
(A) Calcium-dependent fluorescence transients evoked by bAPs, uEPSPs, and bAP/uEPSP pairings in the presence of 10 µM NBQX. (B) Comparison of peak calcium influx in spines evoked by bAP, uEPSP, and bAP/uEPSP pairing, in the presence of 10 µM NBQX. Inset: whole-cell recordings from glutamate uncaging in the presence of NBQX. Calcium influx evoked by pairing was significantly higher than by the uEPSP alone, t-test: N = 12/8/2, t = 4.01, p = 5.8 × 10⁻⁴. (C) Maximum z-projection of Alexa 594 fluorescence from a L2/3 pyramidal cell with a whole-cell recording in the soma and consecutive loose-patch recordings in two branches. Insets: red fluorescence overlaid on differential interference contrast image of loose-patch configuration for each dendrite. The full apical dendritic morphology was not imaged. (D) Calcium-dependent fluorescence transients evoked by bAPs in each dendrite from panel C, recorded during loose-patch recordings. (E) Electrical signals evoked by bAPs measured with dendritic loose-patch recordings in each dendrite from panel C. Inset: expanded trace from gray shaded region. (F) Somatic whole-cell recording of bAPs during each loose-patch recording from panel C. Inset: expanded trace from gray shaded region. (G) Average calcium-dependent fluorescence transients evoked by bAPs in high (black) and low (blue) ΔCaAP branches during loose-patch recordings. (H) Average electrical signal evoked by bAPs in high (black) and low (blue) ΔCaAP branches measured with loose-patch recordings. (I) Comparison of peak calcium influx and peak electrical signal evoked in each dendrite by bAPs. Patches indicate selection of high (gray) and low (blue) ΔCaAP branches used in panels G and H (N = 19/15/9).
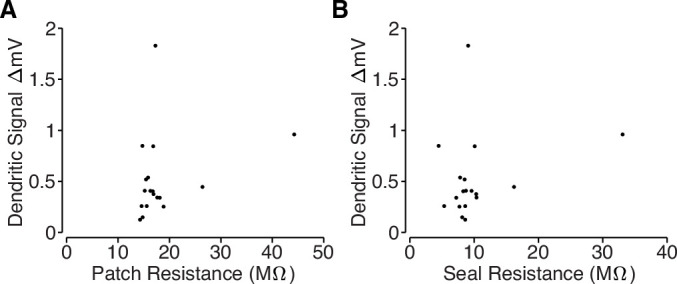
Figure 4—figure supplement 1. Loose-patch recording properties.


