
Figure 5. bAP amplitude is attenuated in low branches.
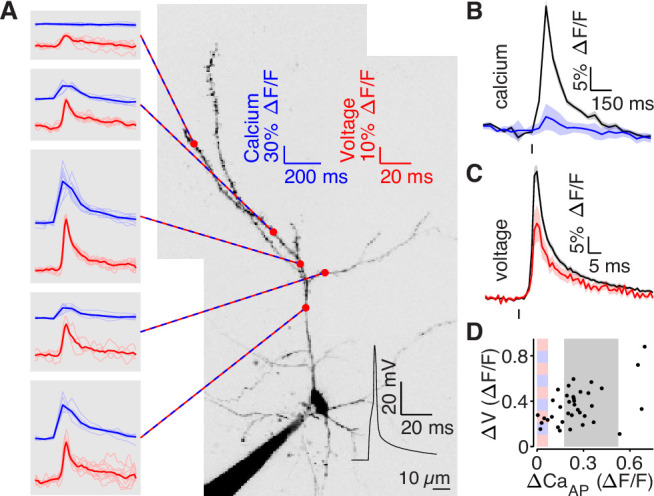
(A) Mean calcium-dependent (blue) and voltage-dependent (red) fluorescence transients evoked by 1 bAP (left) measured in the 5 branches indicated in the maximum z-projection of Alexa 594 fluorescence from a L2/3 pyramidal cell (right).The black trace shows the bAP waveform recorded from the soma during calcium and voltage imaging. Note that calcium- and voltage-dependent transients are shown on ~10 fold different time scales. The full apical dendritic morphology was not imaged. (B) Average calcium-dependent fluorescence transient in high (black) and low (blue) Δ CaAP branches evoked by 1 bAP. (C) Average voltage-dependent fluorescence transient in high (black) and low (red) Δ CaAP branches evoked by 1 bAP. (D) Comparison of the peak voltage- and calcium-dependent fluorescence transient evoked by 1 bAP. Shaded regions indicate selection criterion for high (gray) and low (blue/red) ΔCaAP branches. Calcium-dependent fluorescence predicted voltage-dependent fluorescence, N = 37, R2 = 0.243, F = 11.2, p = 1.9 × 10⁻³ and the y-intercept was significantly above 0, y-int = 0.235, t(35)=5.34, p = 5.6 × 10⁻³.