
Figure 6. Low ΔCaAP dendrites have a more elaborate branch structure than high ΔCaAP dendrites.
(A) Maximum z-projection of Alexa 594 fluorescence from a L2/3 pyramidal cell. Dots indicate location of calcium imaging sites for a high (black) and low (blue) ΔCaAP branch. The two sites are approximately the same distance from the soma (high ΔCaAP: 145 µm, low ΔCaAP: 131 µm). (B) Calcium-dependent fluorescence transient evoked by bAP in high (black) and low (blue) ΔCaAP sites from panel A. (C) Comparison of ΔCaAP in distance-matched, within-cell pairs. N = 20/8/8, N = 12 pairs, Ratio: 0.17, (range: 0.06–0.29). (D) Comparison of the distances from the soma for each pair of recording sites. (E) Comparison of branch complexity in high (black) and low (blue) ΔCaAP sites, using a distance-discounted measurement of nearby dendritic branches. Branch complexity was significantly higher in low ΔCaAP sites, U-Test, U = 215, z = 3.73, p = 1.9 × 10⁻⁴. (F) Comparison of input resistance for high (black) and low (blue) ΔCaAP sites shown in panels C and D, measured in computational simulations of compartment models of each cell in NEURON. Input resistance was significantly lower in low ΔCaAP sites, U-Test, U = 213, z = 3.61, p = 3.1 × 10⁻⁴. (G) Average number of branches at a given distance from a recording site for high (black) and low (blue) ΔCaAP dendrites. This curve was multiplied by a symmetric exponential filter with a length constant of 145 µm and then integrated to compute the branch complexity in panel E. Mean ± SEM. (H) Schematic of morphologies with same branch order but different branch complexity. The blue and black site in each neuron have the same branch order, but the branch complexity of the blue site is higher due to the number of branches distal to the site (left), the number of branches on a sister dendrite (middle), and the distance from a previous branch (right).

Figure 6—figure supplement 1. bAP-evoked calcium influx attenuates around branch points.
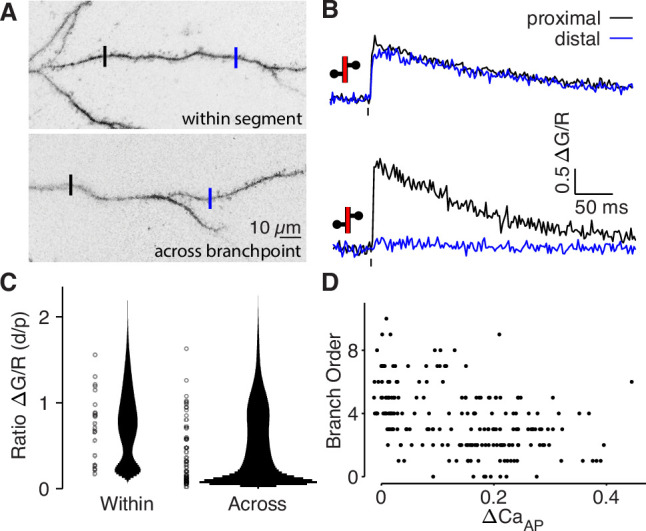
Figure 6—figure supplement 2. Back-propagating APs span 145 µm in L2/3 cell dendrites.

Figure 6—figure supplement 3. Branch complexity is correlated with input resistance.
