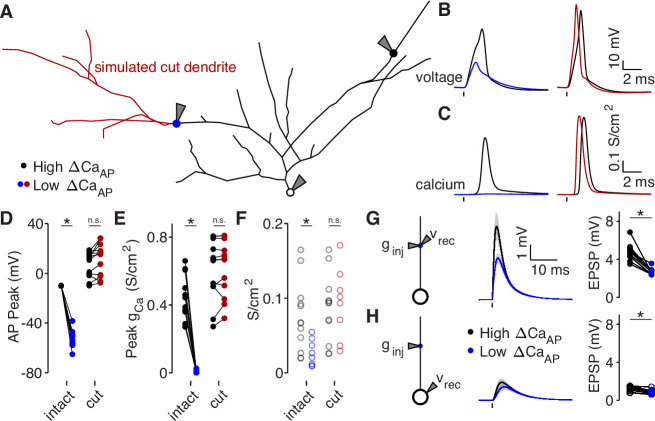
Figure 7. Dendritic branch structure is sufficient to explain reductions in bAP-evoked calcium influx.
(A) Schematic of a neuron morphology used for NEURON simulations derived from the neuron shown in Figure 6A. Blue and black dots indicate high (black) and low (blue) ΔCaAP recording sites. Red dendrites indicate section of dendrite that was computationally ‘cut’ in a subset of experiments. Recordings and injections were performed at the sites indicated with the gray triangles. (B) Dendritic voltage recordings of bAPs from high (black) and low (blue/red) ΔCaAP sites in panel A in NEURON for an intact cell (left) or with cut dendrites (right). (C) Calcium conductances recorded from high (black) and low (blue/red) ΔCaAP sites in panel A evoked by a back-propagating bAP in NEURON for an intact cell (left) or with cut dendrites (right). (D) Comparison of peak bAP voltage for each high/low ΔCaAP pair recorded in NEURON from same sites as experimental recordings, for intact and cut cells (N = 12). Dendritic potassium channel density was fit so the high ΔCaAP site would have a peak of –10 mV in intact cells. AP Peak was significantly reduced in low ΔCaAP sites in the intact cells (U-Test, U = 78, z = 4.13, p = 3.7 × 10⁻⁵) but not different in cut cells (U-Test, U = 168, z = 1.01, p = 0.31). (E) Comparison of peak calcium conductance during bAP for each high/low ΔCaAP site pair, as in panel D. Peak calcium conductance was significantly reduced in low ΔCaAP sites in the intact cells (U-Test, U = 78, z = 4.13, p = 3.7 × 10⁻⁵) but not different in cut cells (U-Test, U = 155, z = 0.26, p = 0.79). (F) A-Type potassium channel density required for the bAP to peak at –10 mV for each site in intact or cut cells. A-Type potassium channel density was significantly reduced in low ΔCaAP sites in the intact cells (U-Test, U = 160, z = 2.58, p = 9.7 × 10⁻³) but not different in cut cells (U-Test, U = 120, z = 0.42, p = 0.67). (G) Left: a synaptic conductance was injected into each site and the local EPSP was recorded in NEURON. Middle: dendritic EPSPs recorded in high and low ΔCaAP dendritic sites. Right: comparison of dendritic EPSP amplitudes recorded in each high/low ΔCaAP pair. Mean ± SEM. Dendritic EPSP amplitude was significantly reduced in low ΔCaAP sites (U-Test, U = 79, z = 4.07, p = 4.7 × 10⁻⁵). (H) Same as in G, but with synaptic conductance injected into dendrite and recorded in the soma. Somatic EPSP amplitude was significantly reduced in low ΔCaAP sites (U-Test, U = 101, z = 2.8, p = 5.1 × 10⁻³), but had a smaller effect size than difference in dendritic EPSP amplitude (see text).


