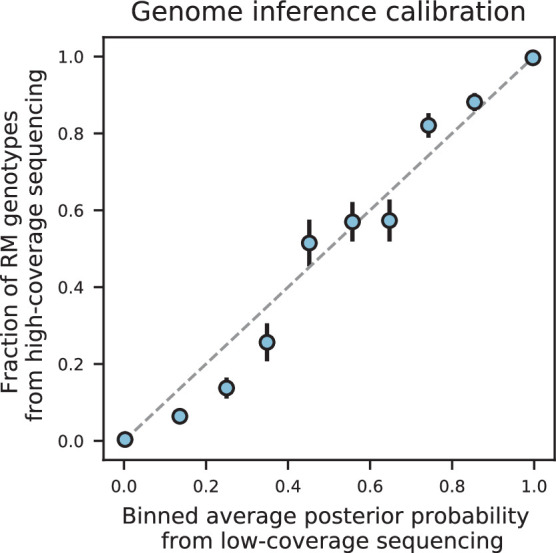
Appendix 1—figure 2. Genome inference calibration.

For a segregant initially sequenced to 0.15 X coverage, loci were binned into 10 equal bins according to their genotype posterior probability. For each bin, we plot the average posterior probability for each bin against the fraction of those loci that were found to be RM in high-coverage sequencing data (i.e. showed a posterior probability of ≥0.99). The dashed grey line represents the expectation for perfectly calibrated posterior probabilities. Error bars are given by where is the fraction of RM loci and is the total number of loci in the bin.
