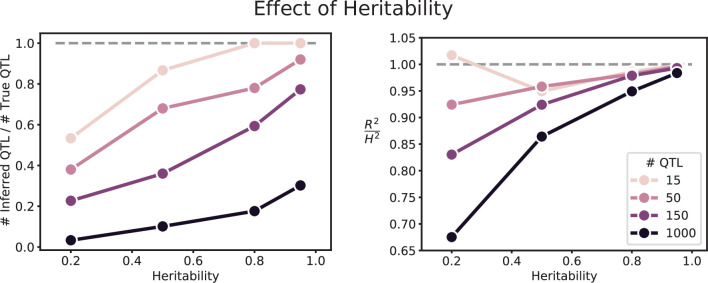
Appendix 3—figure 5. Effect of heritability on QTL inference (for 10,000 segregants).
Left: Number of inferred QTL, as a fraction of the number of true QTL. Right: Model performance ( on a test set of individuals) as a fraction of heritability . Dashed line represents , meaning all of the genetic variance is explained by the model.

