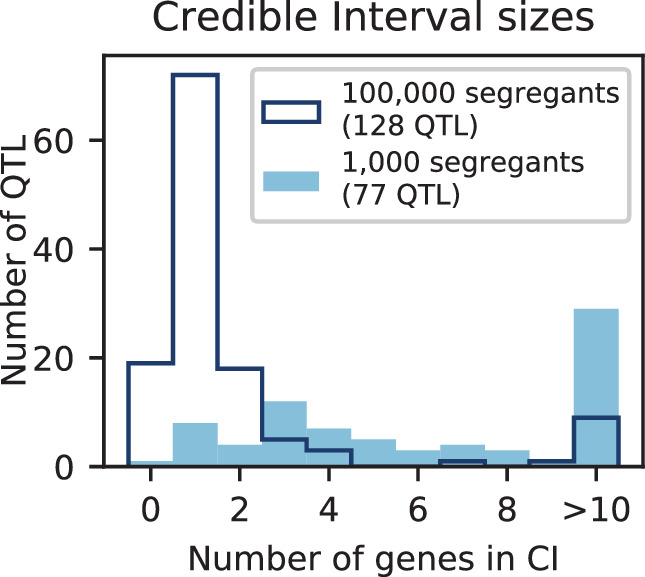
Appendix 3—figure 6. Number of genes contained in 95% credible intervals inferred on simulated data (at 150 QTL), for 1000 segregants (light blue shaded) and 100,000 segregants (dark blue outline).

Total numbers of inferred QTL are given in the legend.
