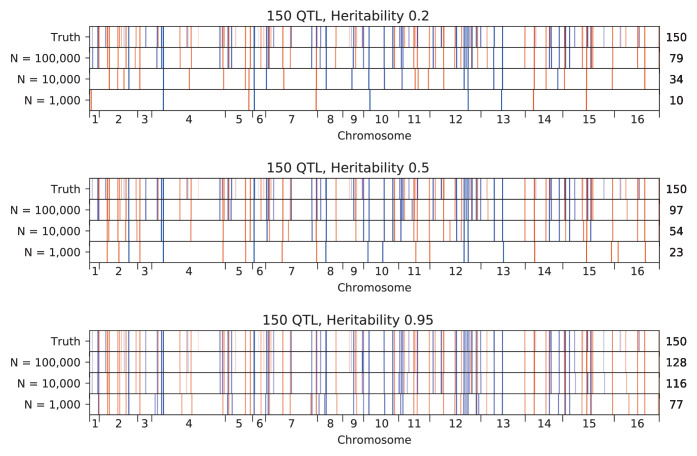
Appendix 3—figure 7. Inferred QTL plotted along the genome, for different sample sizes.
The true model (same for all subfigures) has 150 QTL and heritability given in the subfigure title. QTL are colored red (blue) if their effect is positive (negative) and opacity is given by effect size (on a log scale). Number of inferred QTL for each model is shown on the right.

