Figure 1.

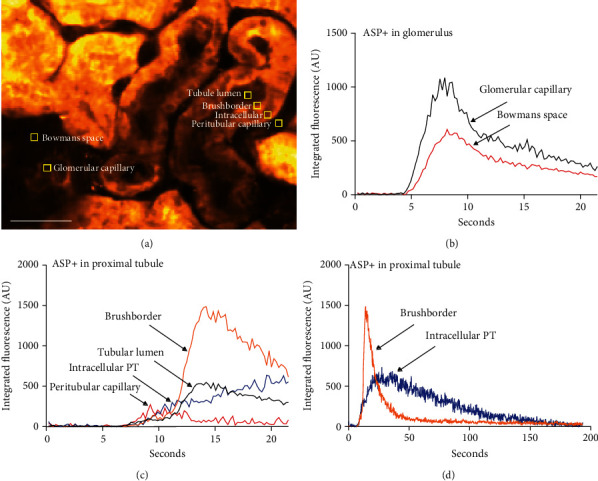
Quantitation of ASP+ signal appearance. (a) 6 ROIs (5 × 5 pixels) were placed in well-defined locations within the tissue. The ASP+ signal (after subtraction of background signal at t = 0) was recorded 5 times per second in each ROI for 21.5 s. Scale bar: 50 μm. (b) Time course of ASP+ signal intensity in the ROIs located in renal corpuscle within the first 21 seconds. The signal increases in the capillary shortly earlier than in Bowman's space reflecting filtration of ASP+ from plasma to primary urine. The passage of the bolus is seen as a peak with a tail in both compartments. (c) Time course (initial 21 seconds) of the ASP+ signal intensity in the ROIs located in the proximal tubule. The signal almost simultaneously increases in the peritubular capillary and intracellularly in the proximal tubular cell. In the capillary, the signal appears as a small peak, whereas in the cell, the signal appears as a steady increase. A few seconds later, a strong signal appears in the tubular lumen and the brushborder. In these locations, the signal appears as a short peak with a tail. (d) Complete time course (app 3 min) of the ASP+ signal intensity in the ROIs located intracellularly and in the brushborder of the proximal tubules. The peak in the brushborder lasts much shorter than the peak of intracellular signal, which shows a long tail.
