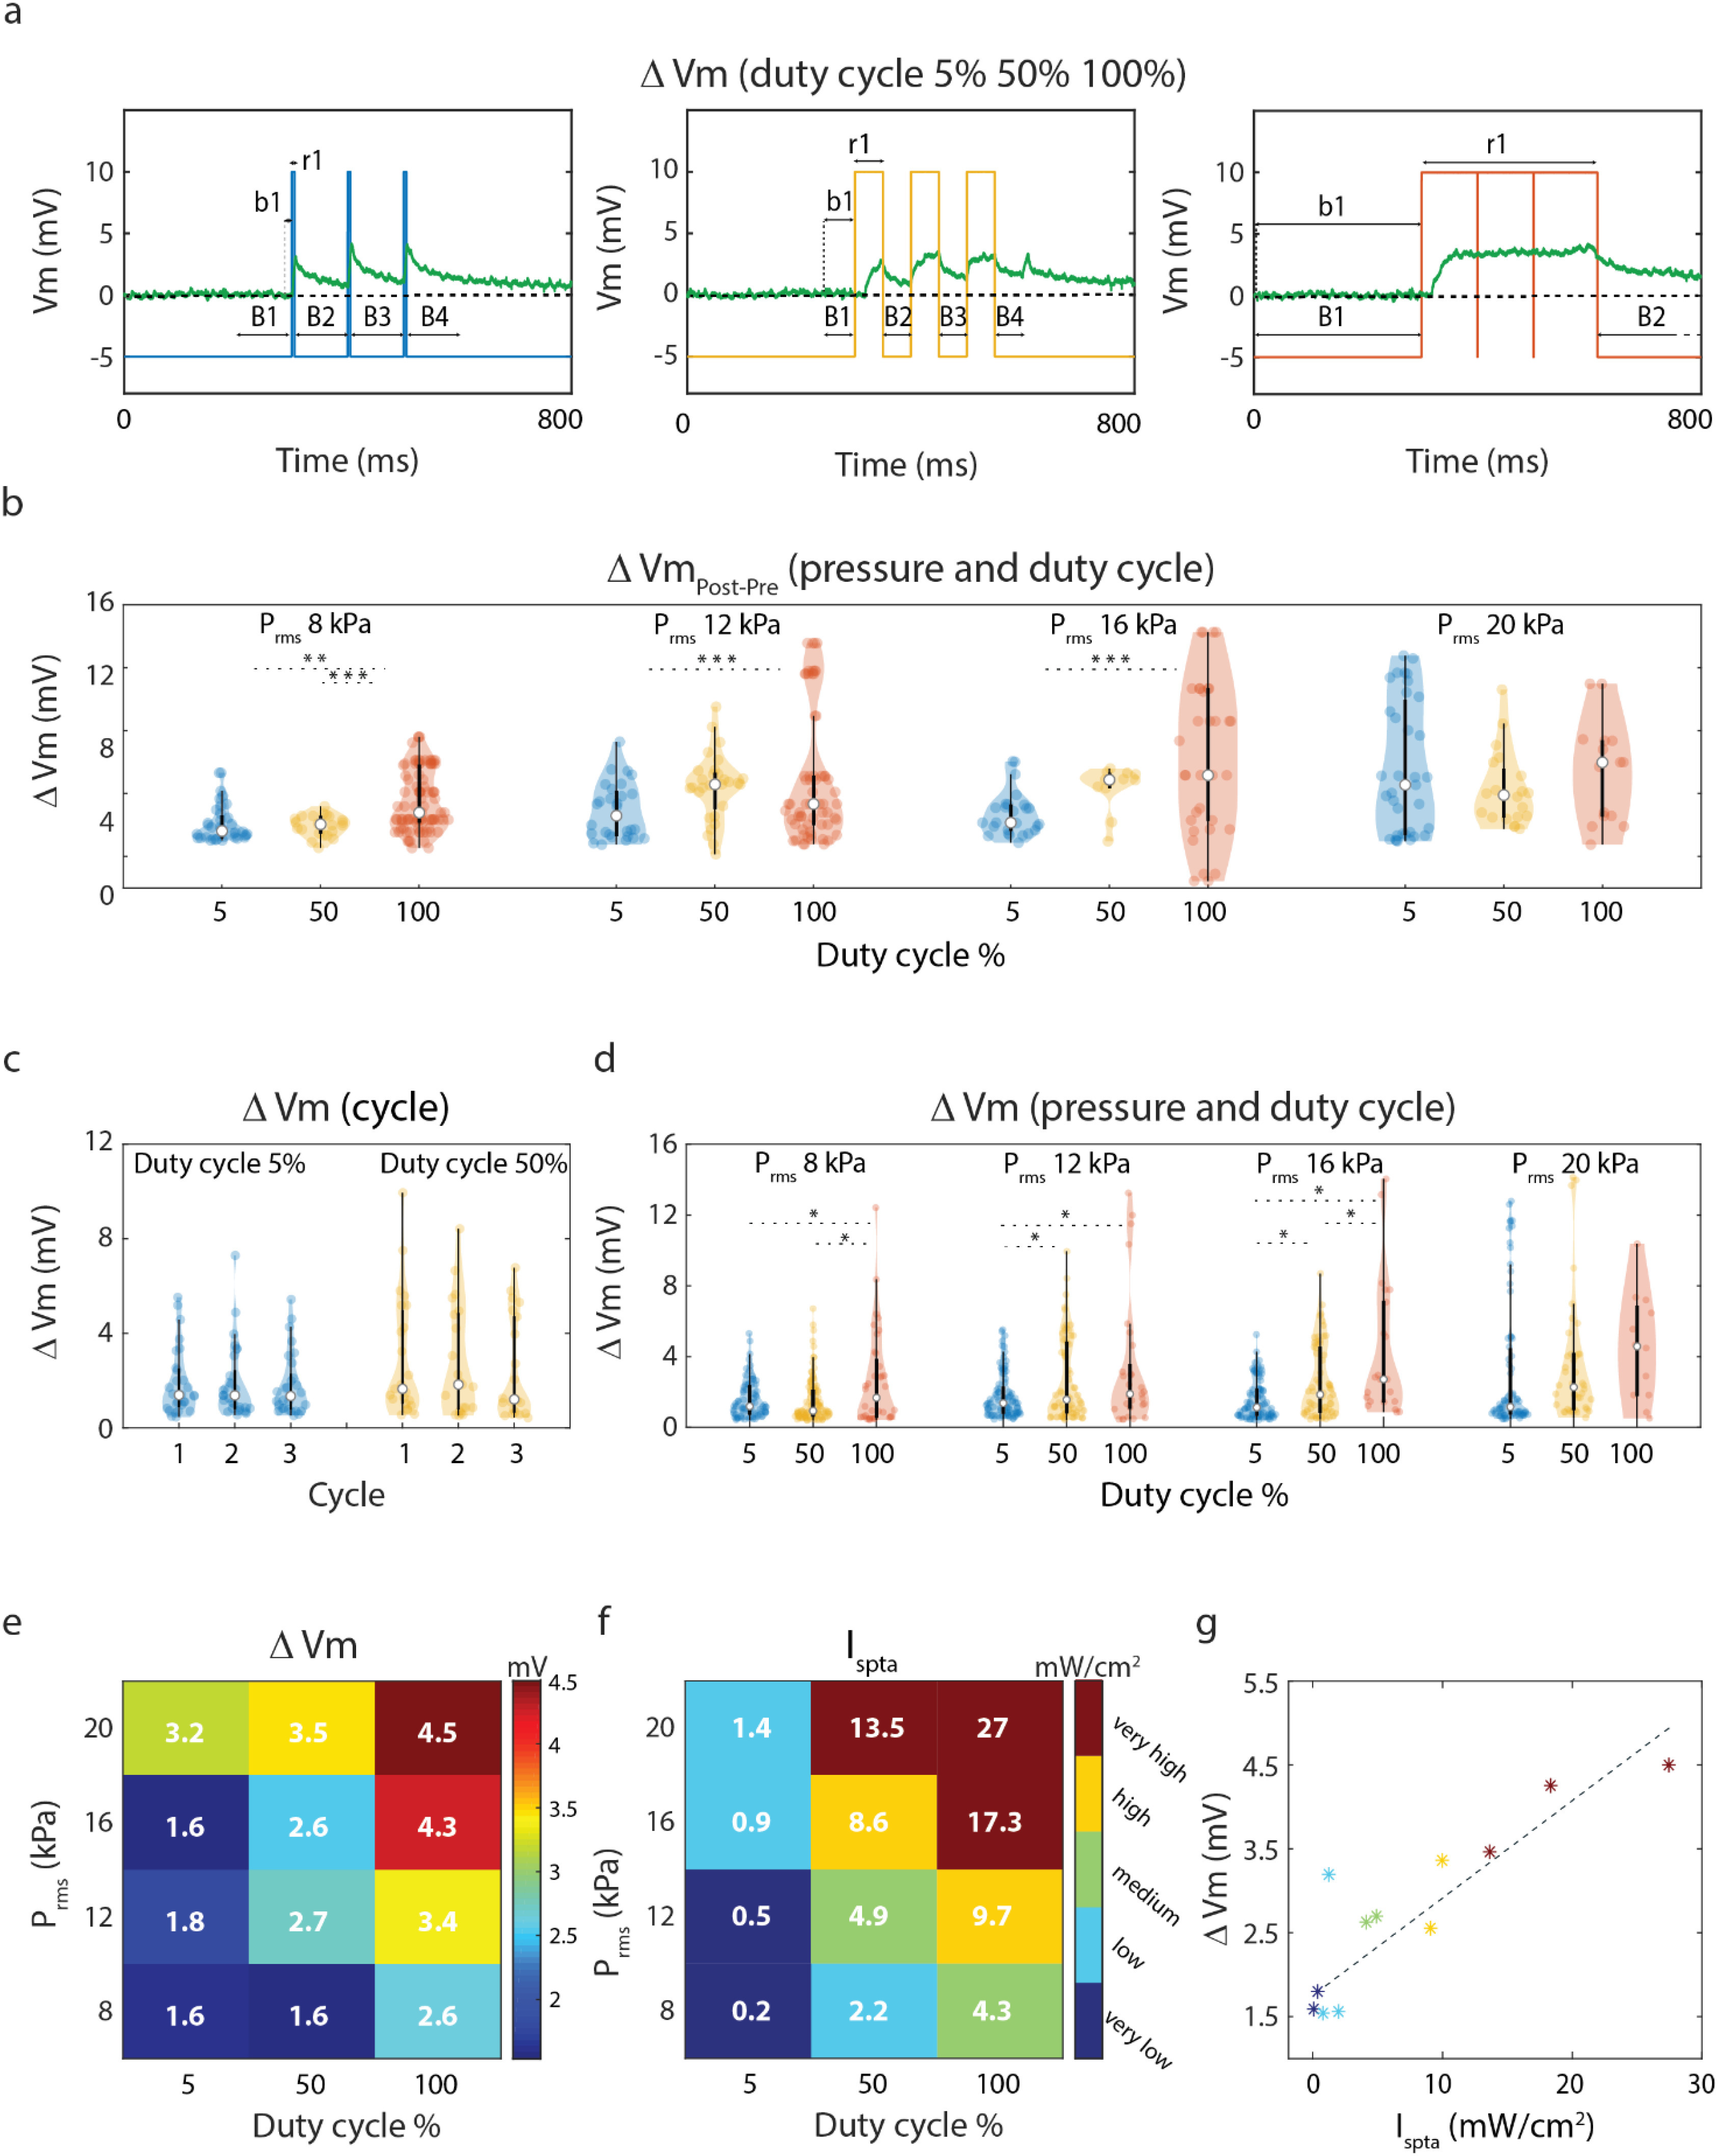
Figure 2.

US parameters and membrane depolarization. (a) Definition of response and baseline interval for each DC; in case of 100% DC, baseline and response time interval is 300 ms; in case of 5% and 50% DC, baseline and response duration are equal to tone burst duration for each cycle. The membrane potential variation ΔV was defined as the difference between the membrane potential median value during stimulus onset (r1 in the figure) and its median value during the preceding baseline (b1 in the figure). (b) Violin plot [37] of baseline variation, defined as the difference between membrane potential pre and post stimulus onset (median Bi+1- median Bi), for each pressure amplitude and DC (95 ms at DC 5%, 50 ms at DC 50%, 300 ms at DC 100%). Asterisks indicate post-hoc significant inter-DC differences (p < 0.05). (c) Membrane voltage variation over the three cycles at DC 5% and 50% for pressure 12 kPa. (d) Membrane potential variation for each pressure amplitude and DC. (e) Median membrane voltage variation for each stimulation protocol setting. (f) Stimulation intensity for each experimental protocol. g) Median membrane potential response as a function of the intensity. Color code in (f) and (g) indicates intensity binning: Ispta is binned into five groups: very low ≤ 0.5 mW/cm2 < low ≤ 2.5 mW/cm2 < medium ≤ 5 mW/cm2 < high ≤ 10 mW/cm2 <very high, with respectively 101, 110, 108, 97, 73 recorded traces.
