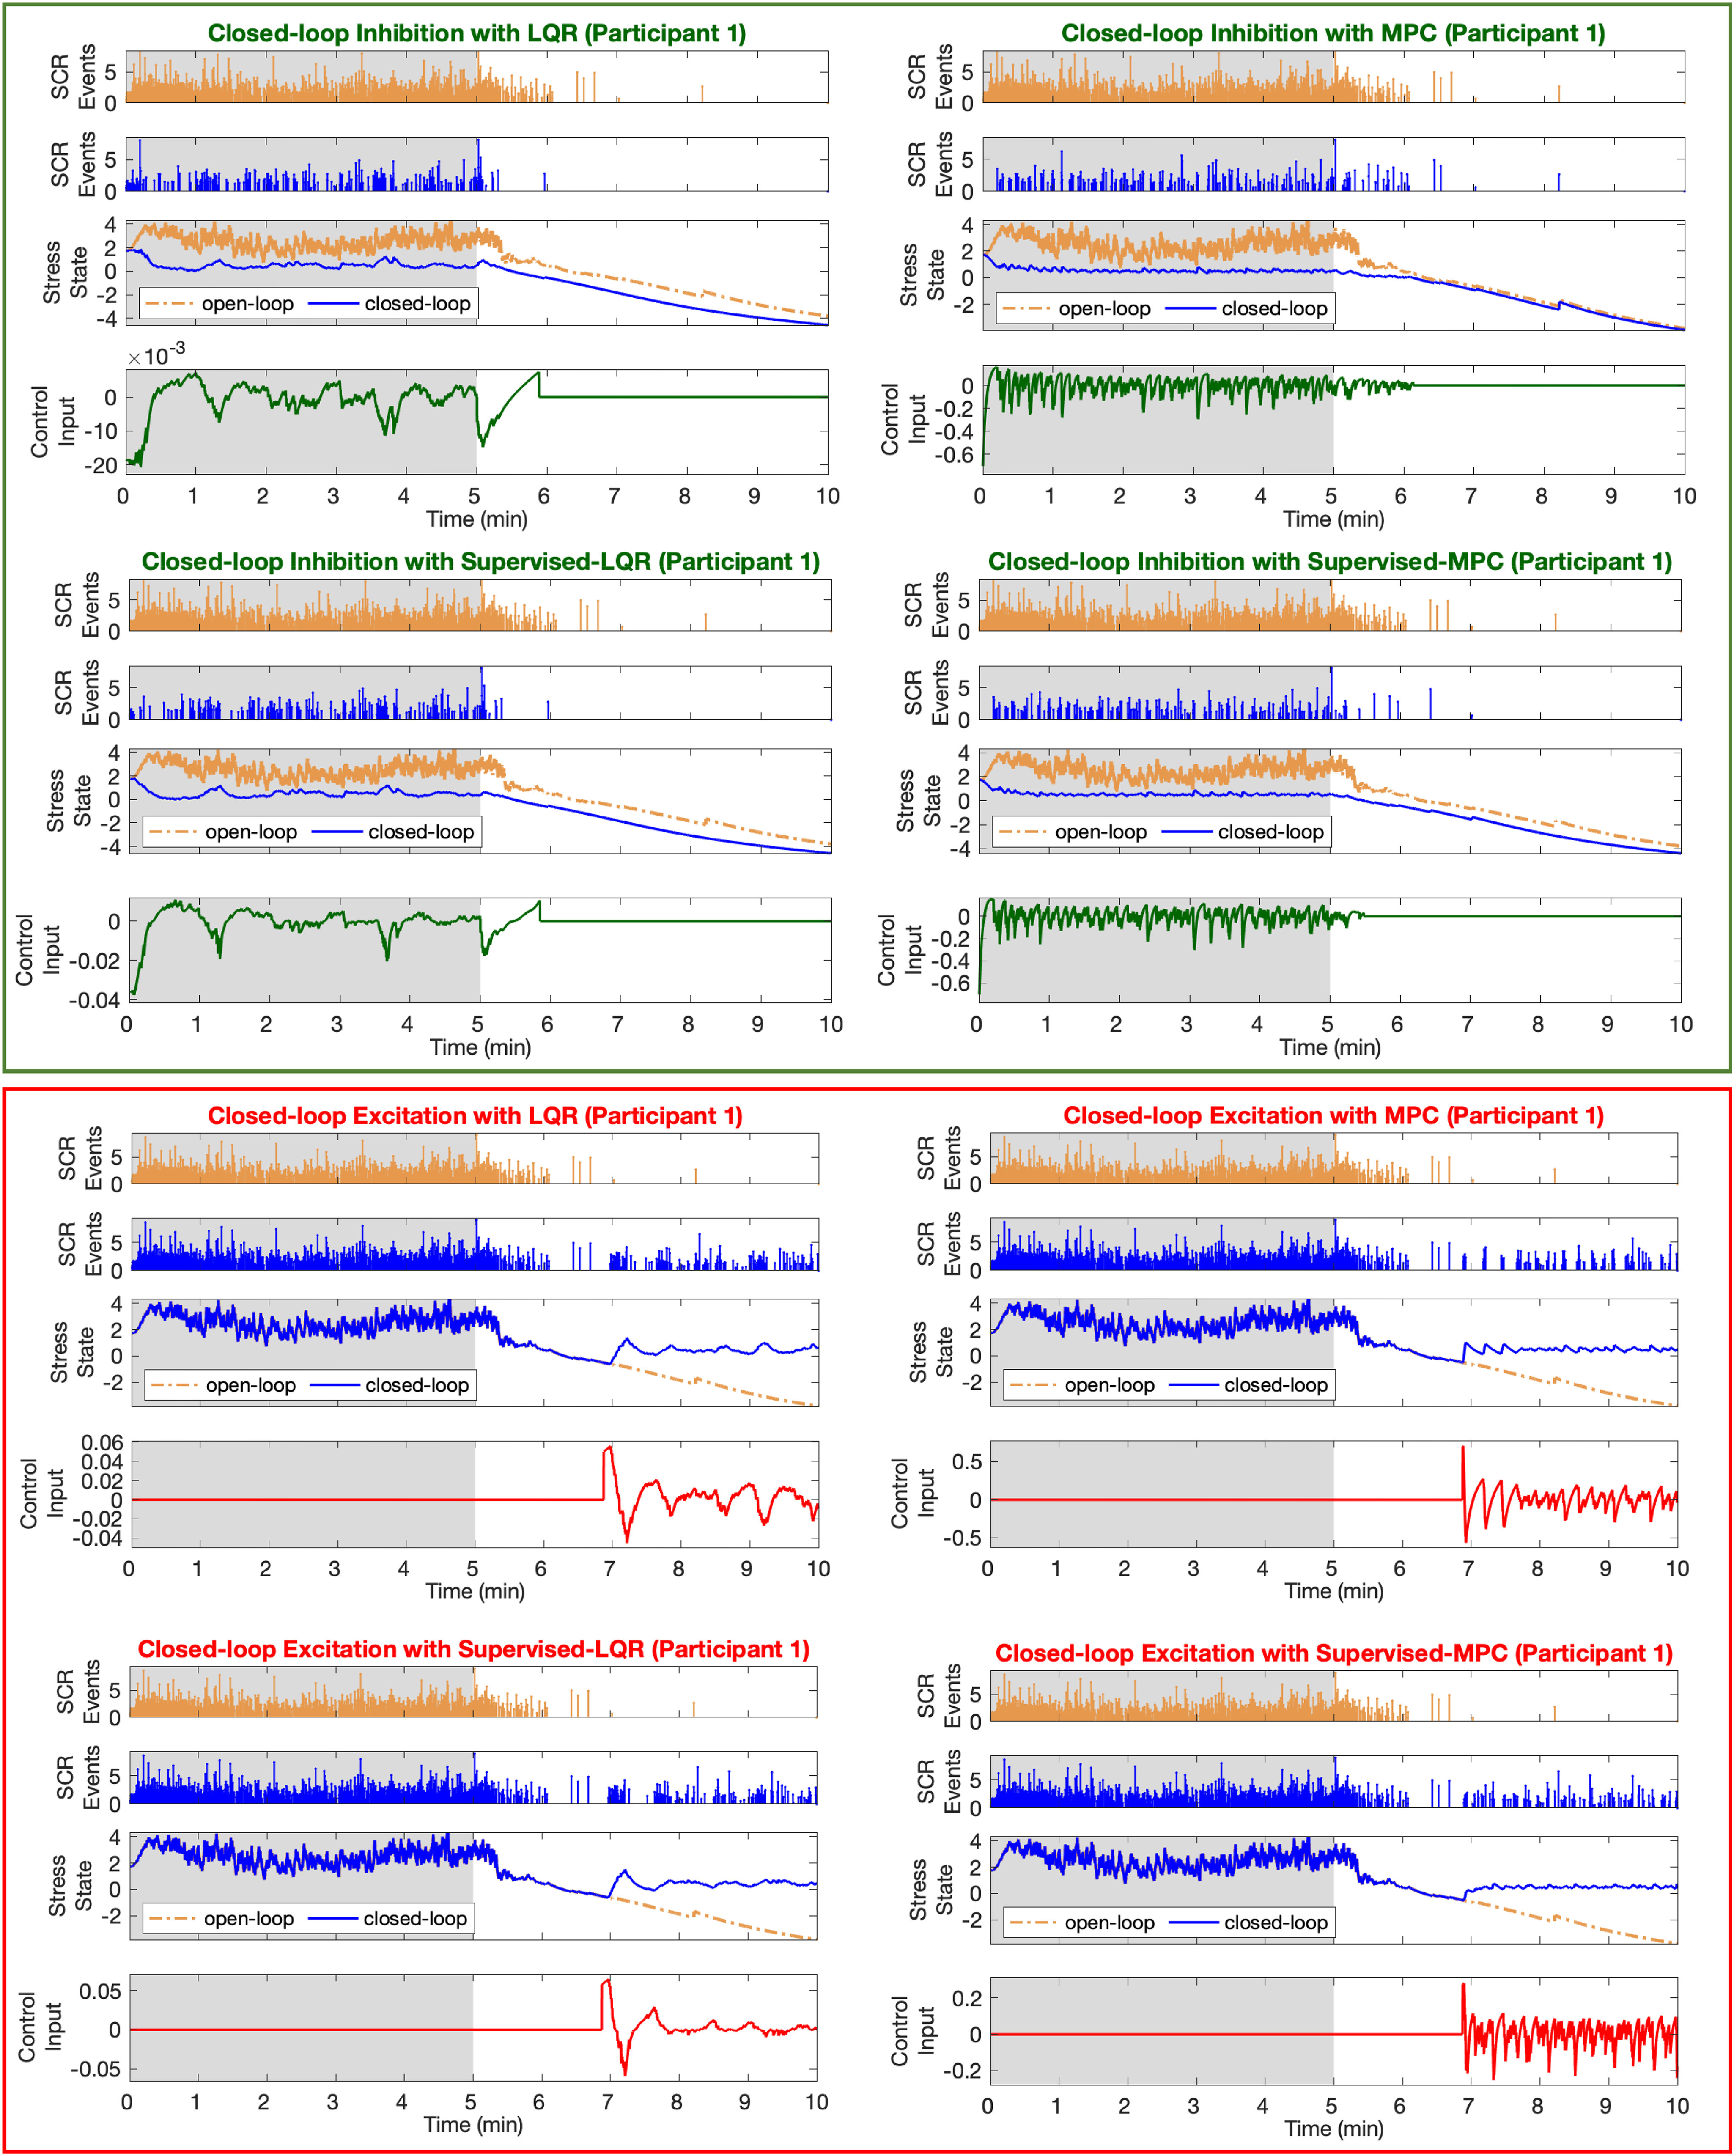
Fig. 3.

Closed-Loop Results (Participant 1). The top four panels show the closed-loop inhibition results. The bottom four panels show the closed-loop excitatory results. In each panel, the top two sub-panels show the SCR events along with their amplitudes in open-loop (orange color) and closed-loop (blue color) cases. The third sub-panel shows the estimated cognitive stress-related state. The bottom sub-panel shows the designed control implemented in real-time to close the loop and either inhibit or excite the estimated stress levels. The gray and white backgrounds correspond to the high and low arousal environmental stimuli, respectively (i.e., cognitive stress condition vs relaxing condition).
