Figure 1.

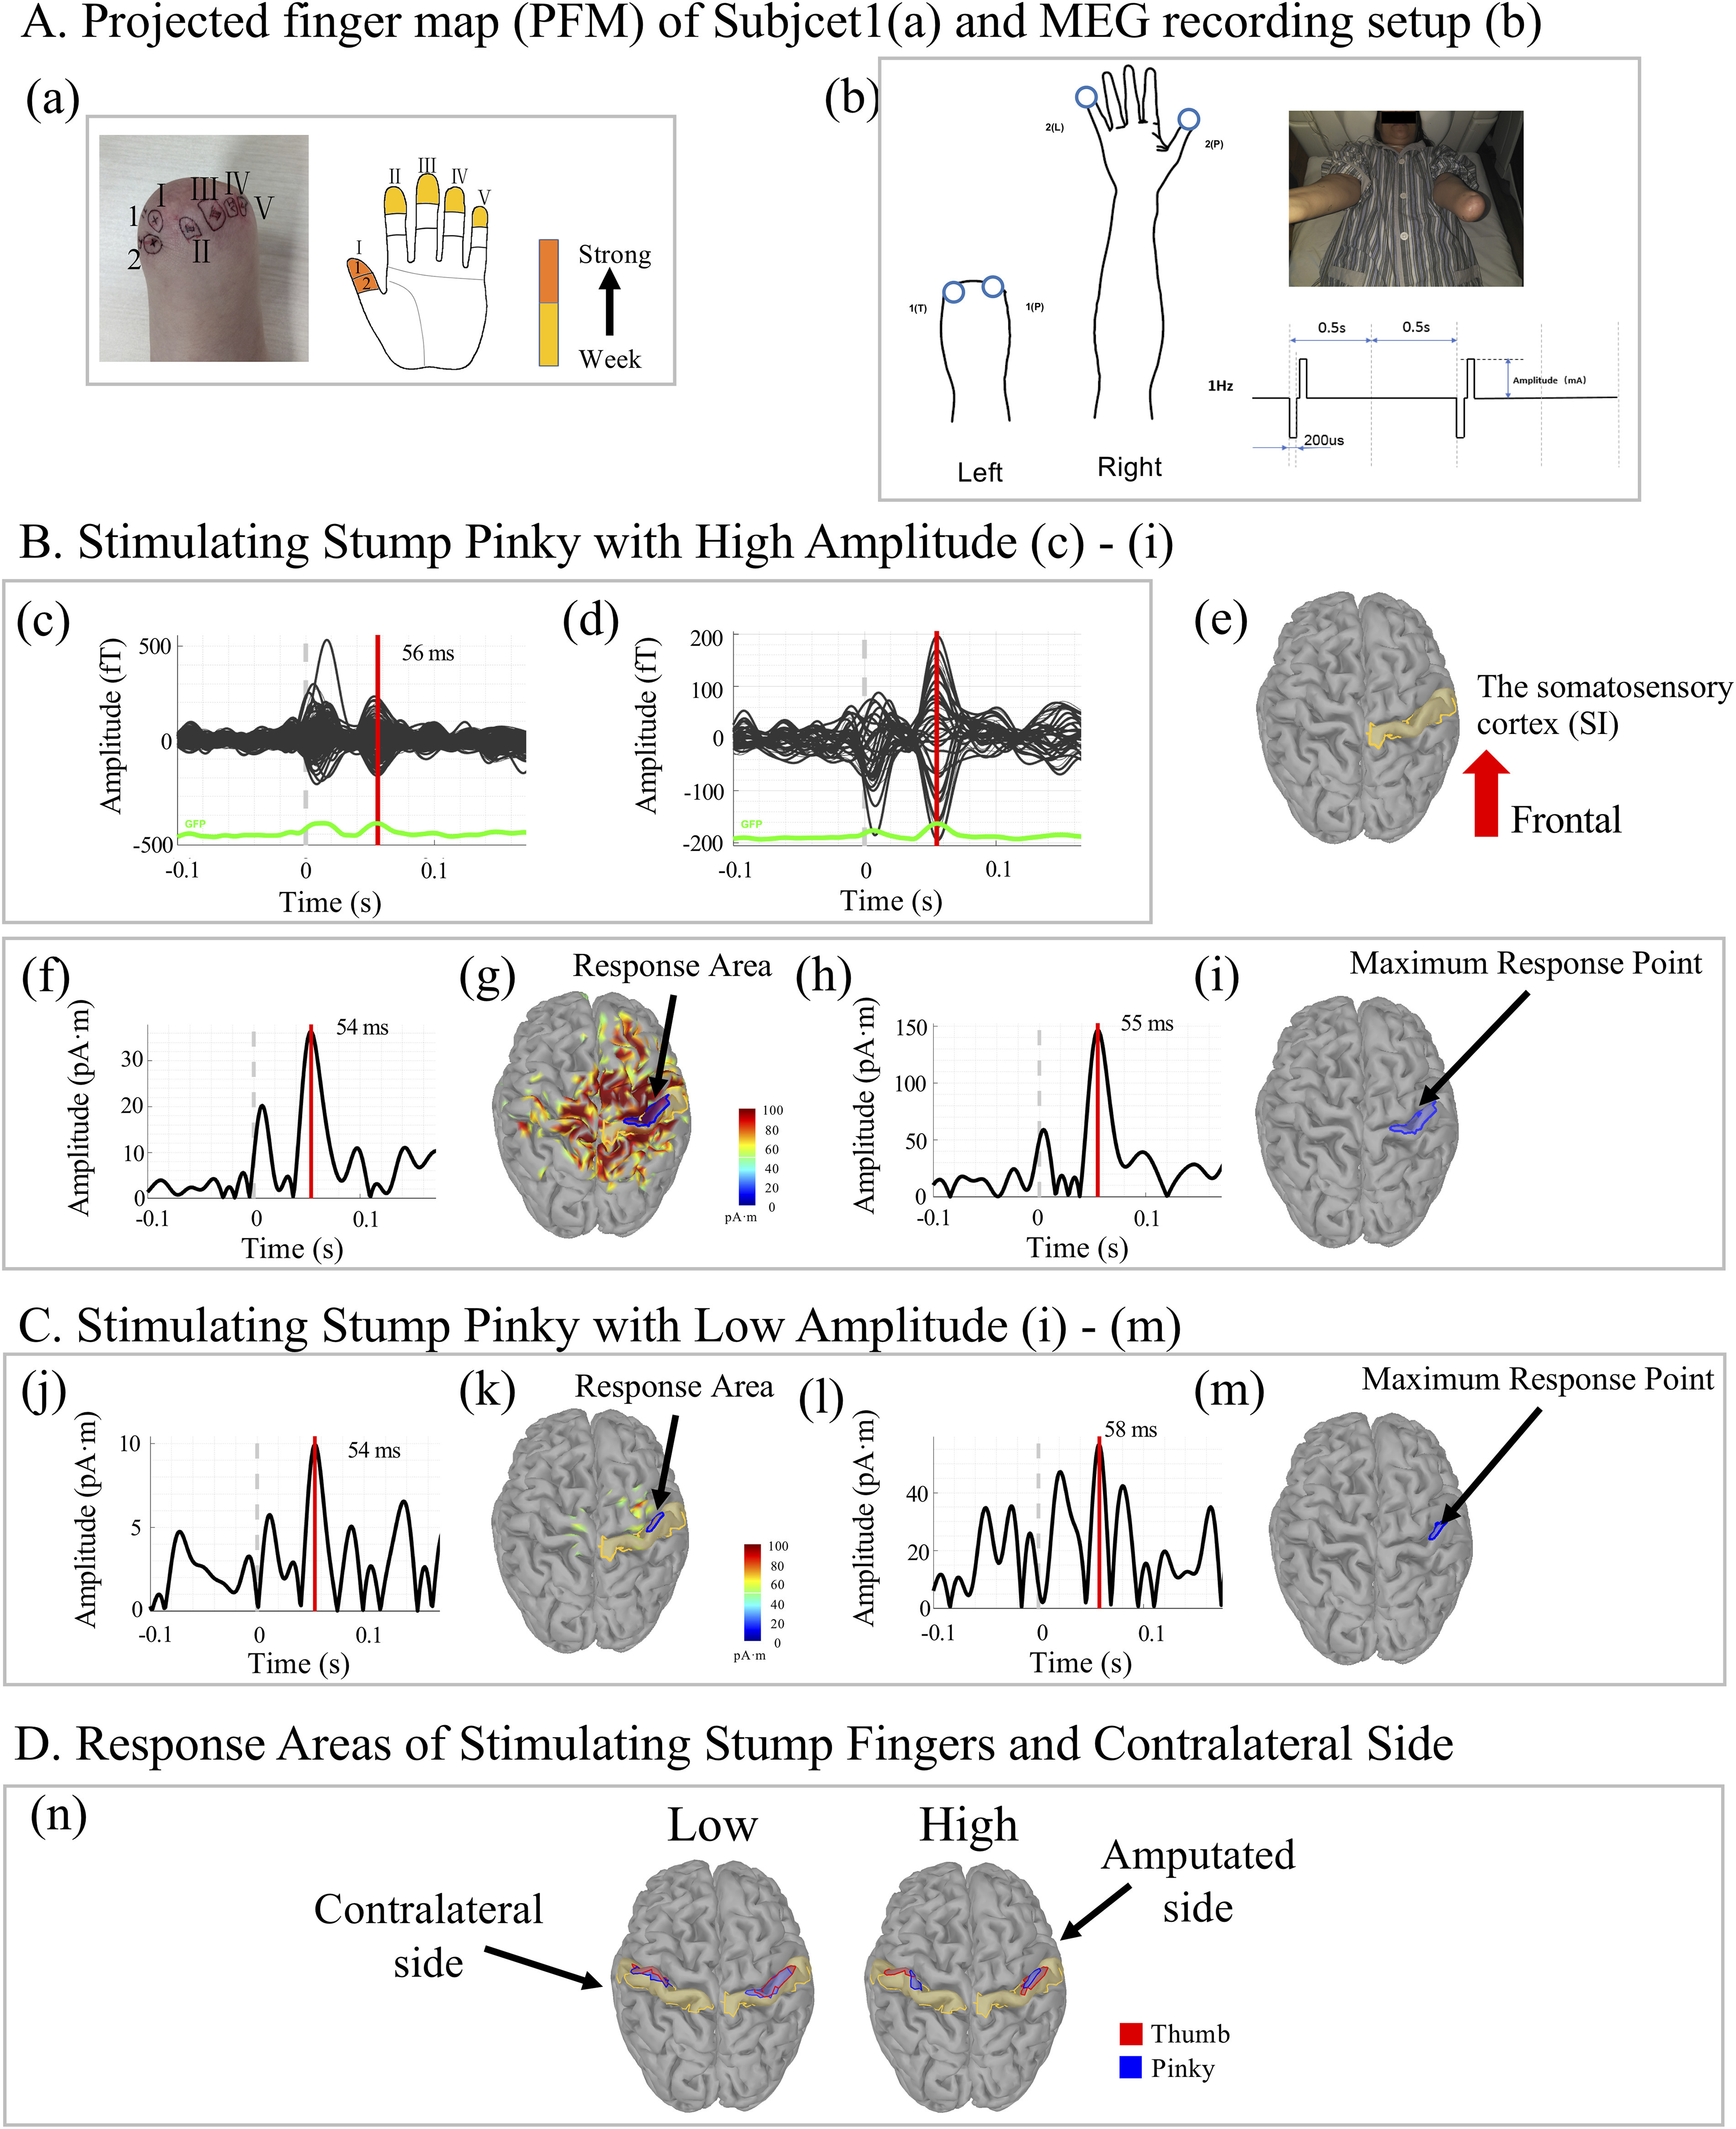
Somatosensory cortex (SI) responses of evoked tactile sensations (ETS) recorded by magnetoencephalography (MEG) in Subject 1. (a) The projected finger map (PFM) of Subject 1. (b) MEG recording was done in a shielded room, where electrical stimulations on the projected finger regions of the stump and the fingers of the contralateral normal hand were delivered with biphasic pulse trains of 1 Hz frequency. (c)-(i) Present a trial that the projected pinky region on the stump was stimulated with high current amplitude (11.25 mA with 2.5 cm diameter stimulation electrode). 102 channels of event related magnetic flux recordings of raw MEG in the whole brain and the right parietal lobe are shown in (c) and (d), respectively. The response time of magnetic flux is 56 ms. The activities seen at time=0 may be due to noise inputs. (e) illustrates the brain model of Subject 1 and the SI area is labelled in yellow. (f) Plots the time profile of the average current dipole of the SI area. The brain activities of response at peak time (54 ms) of SI are shown in (g). The blue circle labels the response area (RA). (h) Plots the time profile of the average current source densities in the RA. The response time (RT) is defined as the peak time of (h), which is 55 ms. The maximum response point is shown in (i), which is defined as the vertex having the max value in the RA at the moment of RT. (j)-(m) present a trial that projected pinky region on the stump is stimulated with low amplitude (3.75 mA with 2.5 cm diameter stimulation electrode). The response areas in SI of 4 sites (projected thumb region of the stump, projected pinky region of the stump, the contralateral thumb and pinky) with high and low are presented as (n).
