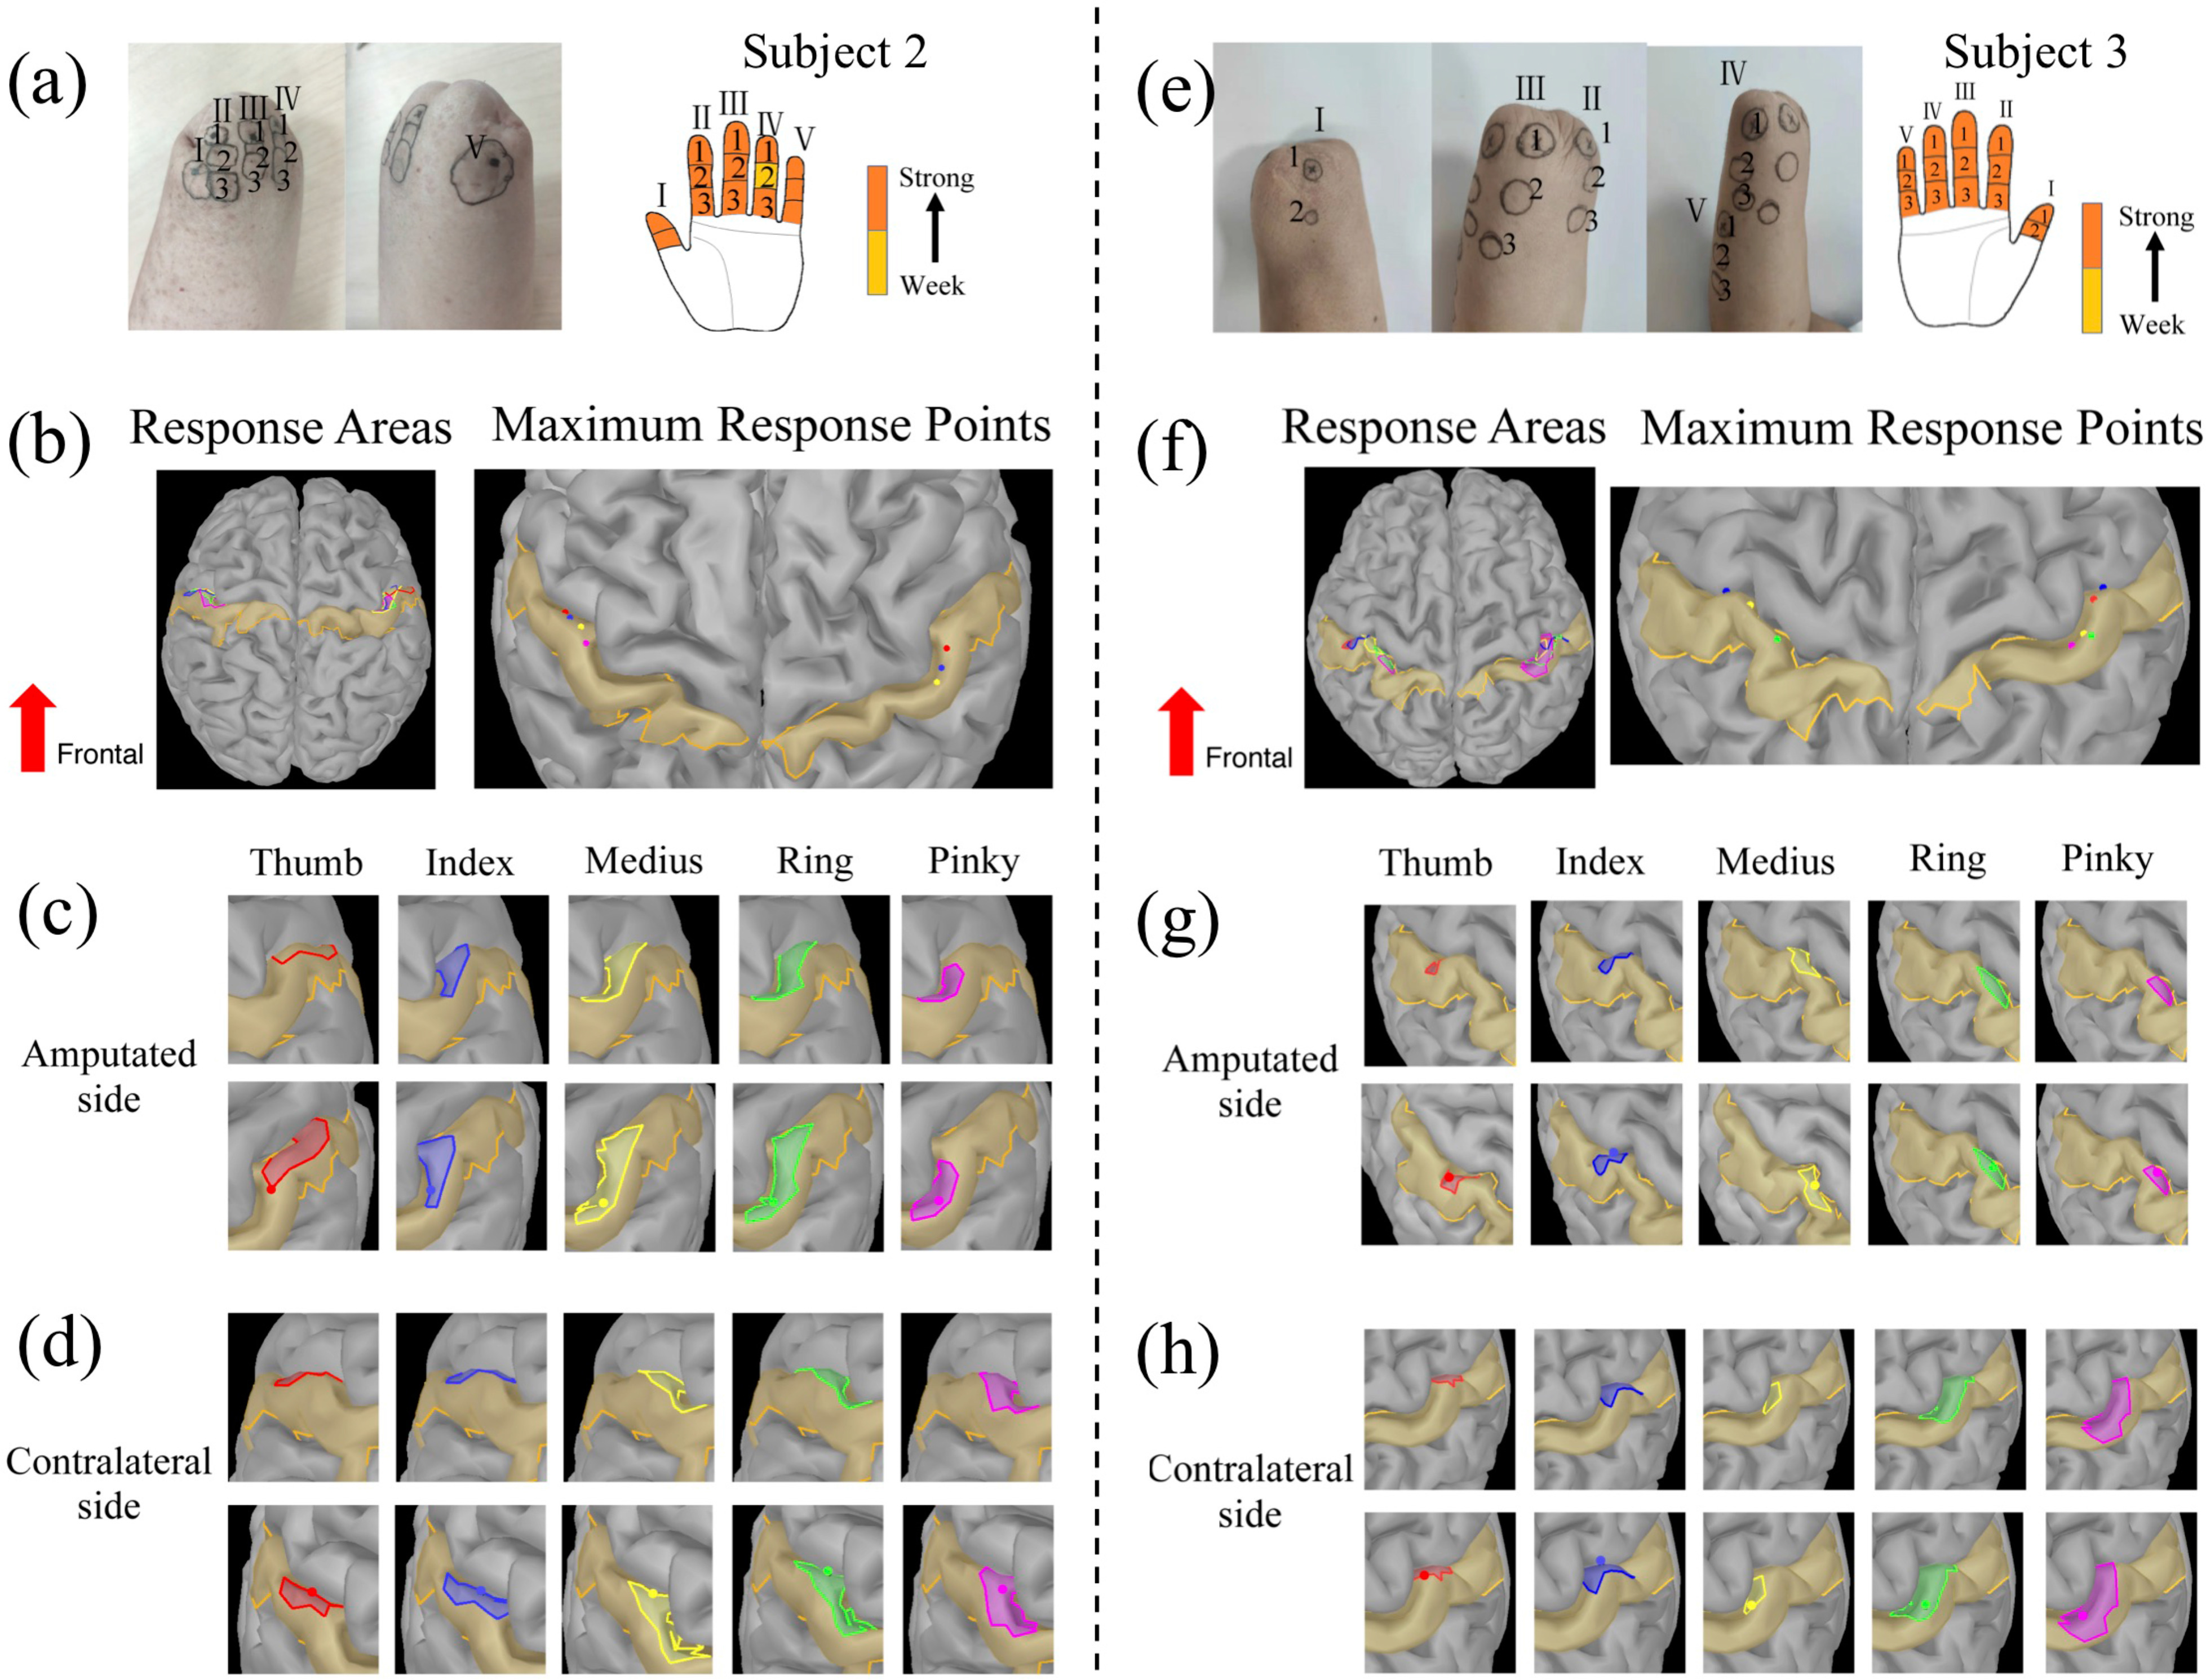
Figure 2.

Response areas (RAs) and maximum response points (MRPs) of evoked tactile sensations (ETS) in the somatosensory cortex (SI) of Subject 2 (a-d) and Subject 3 (e-h). The PFMs of Subject 2 and Subject 3 are shown in (a) and (e), respectively. (b)-(d) Illustrate RAs and MRPs of SI when stimulating the five PFM regions on the stump and the five fingers of the contralateral hand of Subject 2. The overview of RAs and MRPs is presented in (b). (c) Depicts the SI responses in the amputated side. Pictures in the upper row show the RAs of five PFM regions from the same perspective; pictures in the lower raw show the position of the MRPs after fine-tuning of the pitch angle. (d) Exhibits the RAs and the MRPs of contralateral SI. (f)-(h) Illustrate the RAs and MRPs of SI for Subject 3 in the similar order.
