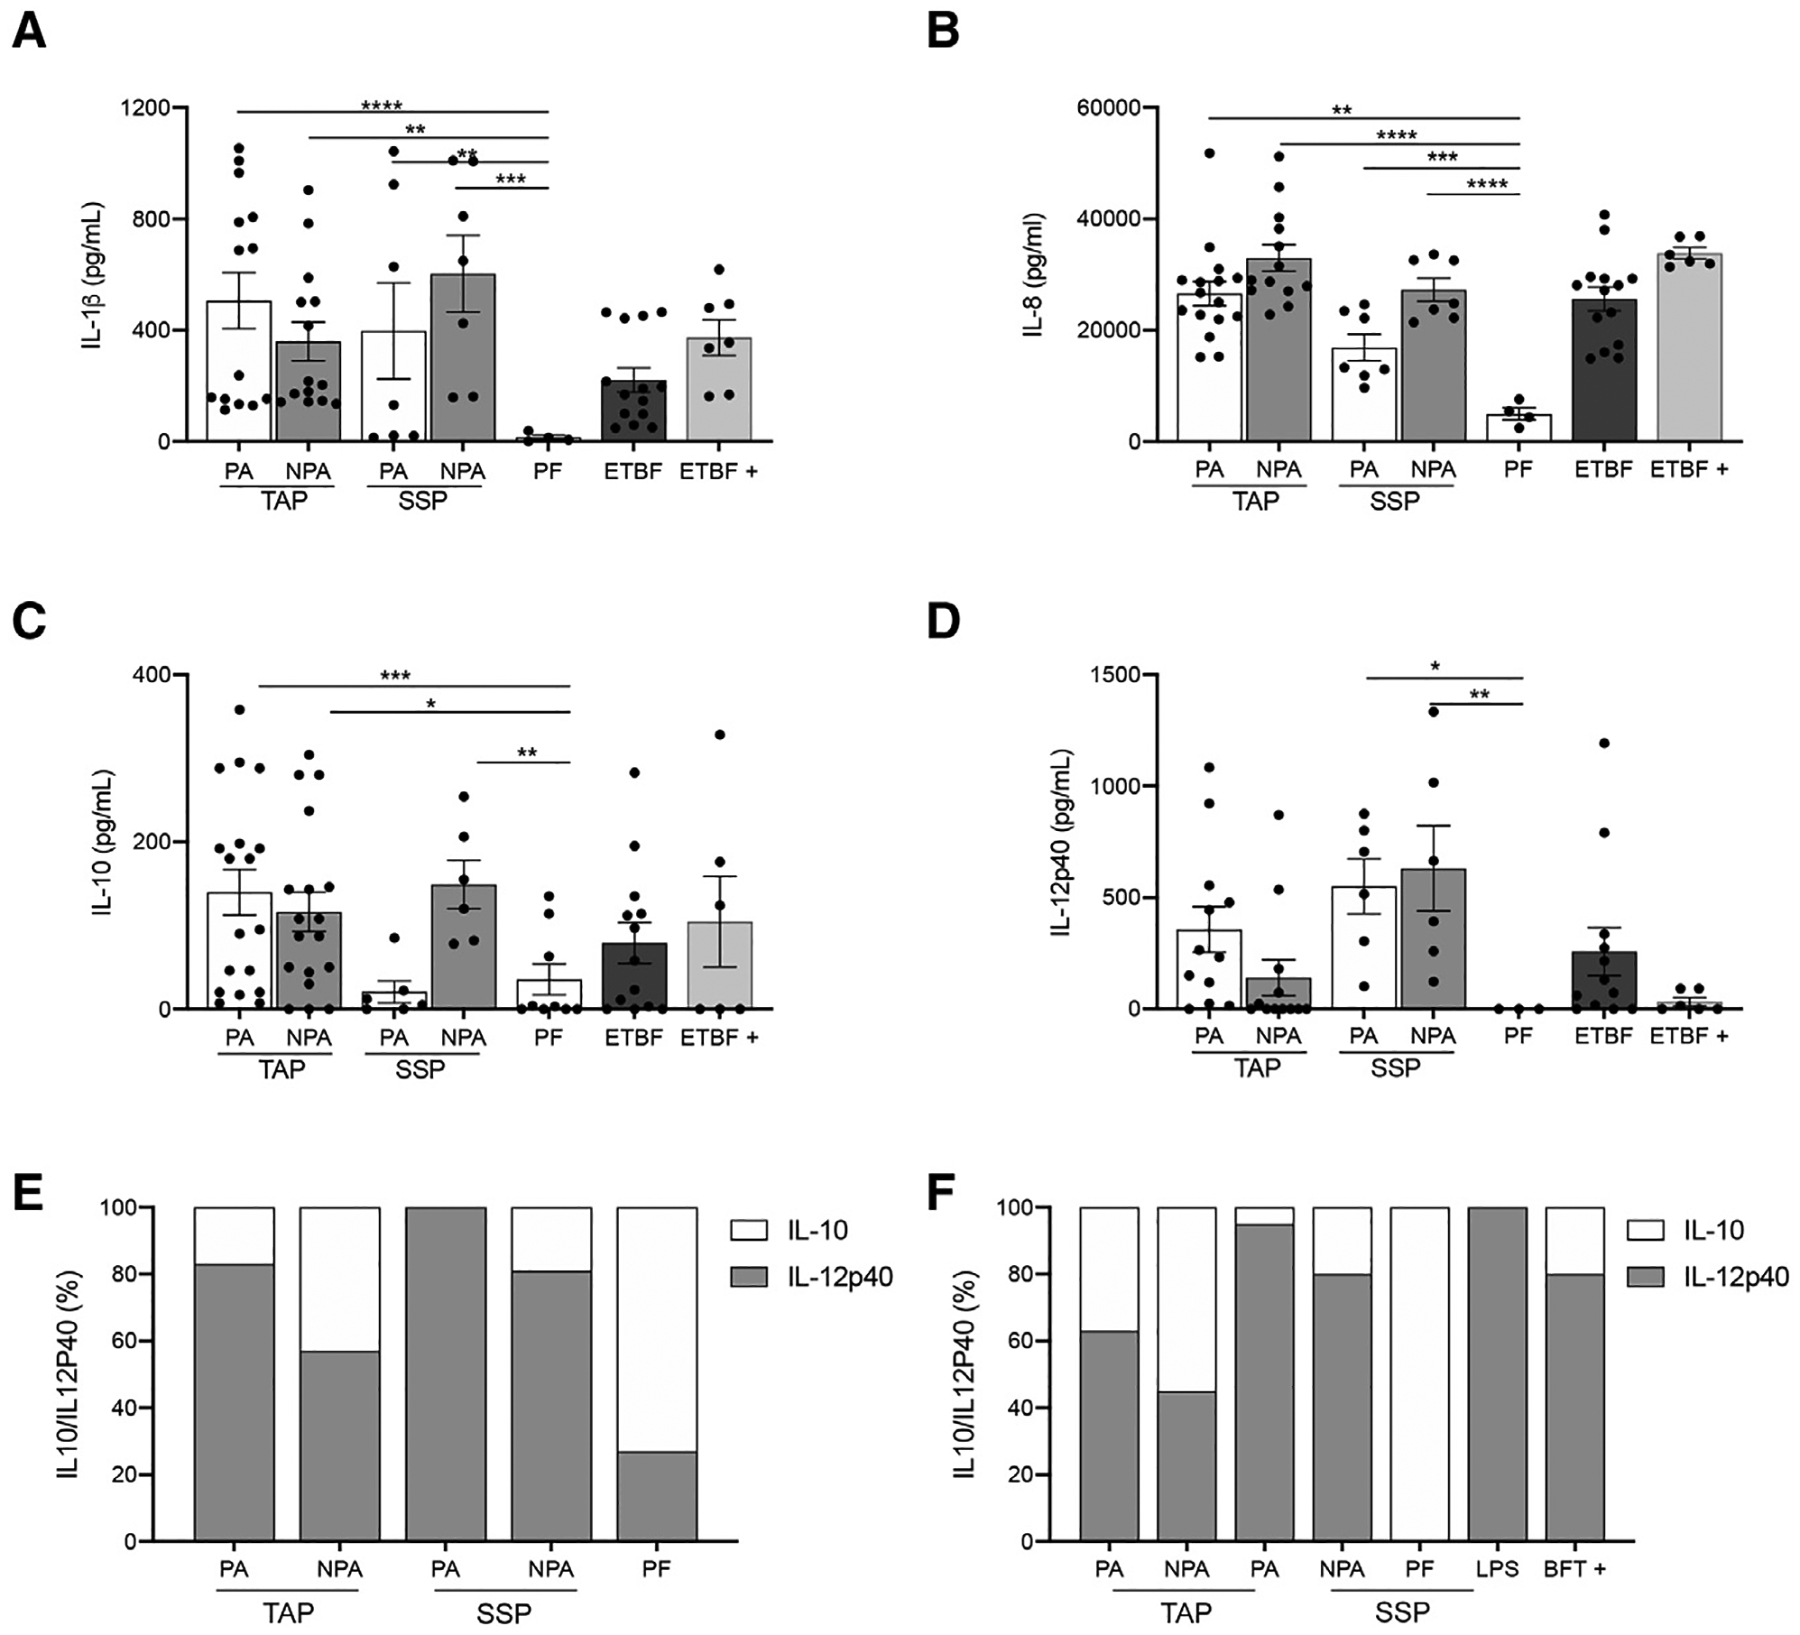
Figure 3. NTBF isolates from patients with polyps induce inflammation in vitro and signal through TLR4.

(A–D) Levels of cytokines detected from co-culturing Bacteroides fragilis supernatants with monocytic cell line by ELISA. Data are represented as the mean ± SEM of 3–4 independent experiments including 16 PA and 16 NPA isolates from 4 different TAP patients, 8 PA and 8 NPA clinical isolates from 2 different SSP patients, and 4 clinical isolates from 1 PF patient. ETBF+ represents the bft positive study isolates that include 4 PA and 4 NPA isolates from 1 TAP patient and 8 isolates from 2 PF patients. ETBF represents a control bft positive strain from ATCC. (A–D), *p < 0.05. ***p < 0.001. One-way ANOVA with multiple comparisons.
(E) Ratio of IL10/IL-12p40 expression detected from co-culturing B. fragilis supernatants with monocytic cell line by ELISA.
(F) Ratio of IL10/IL-12p40 expression in biopsy tissue samples detected by ELISA. See also Figure S4.
