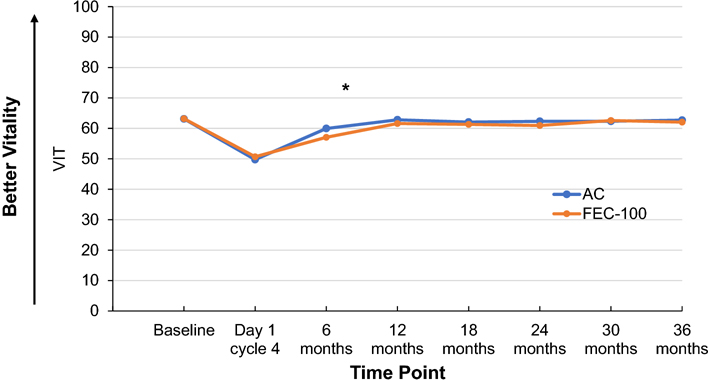
Figure 3. SF-36 Vitality scale score by treatment group and time point.
Adjusted least-square mean scores for all timepoints after baseline are obtained from mixed model for repeated measures analysis of the score.
AC, doxorubicin and cyclophosphamide; FEC-100, 5-fluorouracil, epirubicin and cyclophosphamide Footnote: *statistically significant differences observed: 6 months: FEC-100:57.06; AC:59.97, difference=−2.91, 95%CI=(− 4.89,−0.93), P value=0.004.

