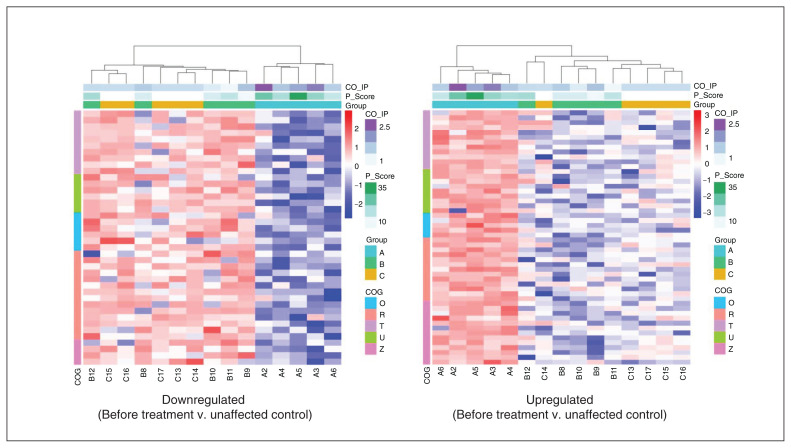
Figure 5.
Hierarchical clustering analysis of differentially expressed proteins of 5 function groups in COG analysis (Figure 4). One sample with outlier data was excluded from each group. The left panel shows analysis of proteins that had lower levels in patients with schizophrenia before treatment versus controls. The right panel shows proteins with higher levels in patients with schizophrenia before treatment versus controls. Differential expression thresholds were a fold change > 1.2 and p < 0.05. Each row indicates a protein, and each column represents a sample. The proteomic profile was associated with clinical assessment of positive symptoms (PANSS positive scale score; P_Score) and D2R-DISC1 complex levels (CO_IP). The heatmap depicts the relative abundance of proteins. Biological functions related to these proteins are denoted on the left (for a key, see Figure 4). Group A: patients with schizophrenia before treatment; group B: patients with schizophrenia after treatment; group C: unaffected controls. COG = Clusters of Orthologous Groups; D2R = dopamine 2 receptor; DISC1 = disrupted in schizophrenia 1; PANSS = Positive and Negative Syndrome Scale.

