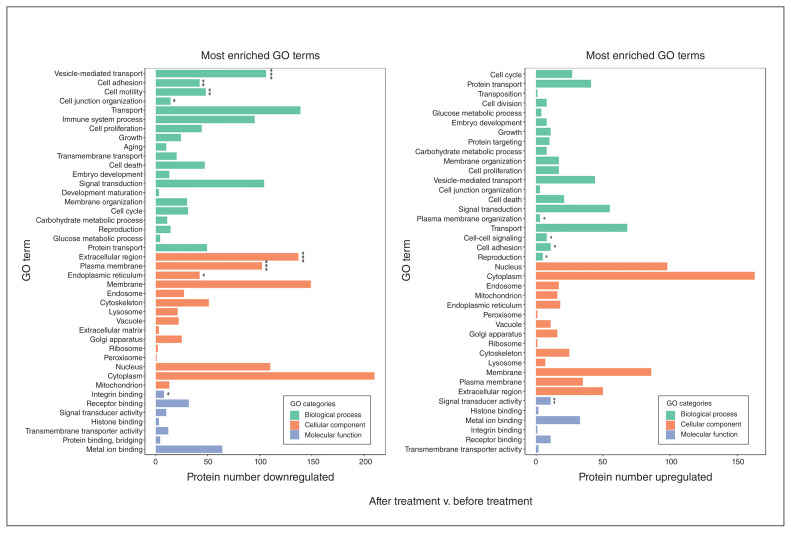
Figure 6.
Analysis of the differential expression of GO-enriched proteins in patients with schizophrenia after treatment versus before treatment. Left: GO enrichment of decreased proteins in patients with schizophrenia after treatment versus before treatment. Right: GO enrichment of increased proteins in patients with schizophrenia after treatment versus before treatment. The graph shows the GO term for each row and the number of differentially expressed proteins on the x axis. The green bars represent biological processes, the orange bars represent cellular components and the blue bars represent molecular functions. *p < 0.05, **p < 0.01, ***p < 0.001. GO = Gene Ontology.

