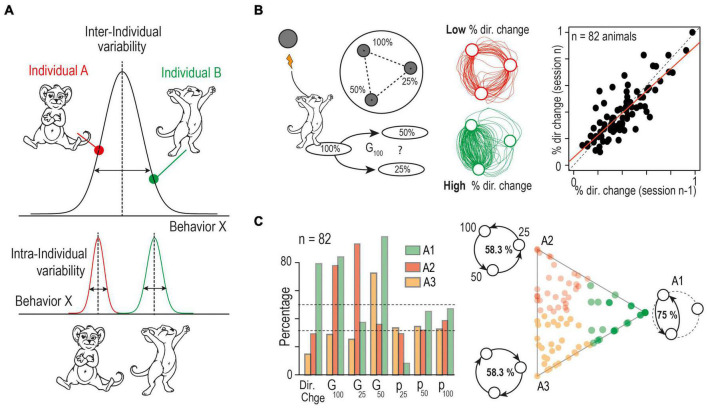
FIGURE 1.
Theoretical framing and experimental distinction between inter- and intra- individual variability. (A) Defining intra and inter-individual variability: the frequency and intensity with which an individual exhibits a specific behavior defines a trait. The estimate of the trait expression at the population level defines inter-individual variations. Repeated measurements on individual subjects allows the estimation of intra-individual variations in trait expression. (B) (Left) Schematic of a behavioral decision-making paradigm where inter- and intra-individual variability is apparent. Mice are placed in a circular open-field with three equidistant targets that are associated with a given probability (100, 50 or 25%) of intracranial stimulation reward delivery when the animal is detected around the target. The animal cannot receive two consecutive stimulations from the same target; thus they must make a sequence of binary choices between the targets. The trajectories and choice or each mouse are quantified using, (i) the percentage of directional change (i.e., returning to the previous target, % dir. change), (ii) the probability to visit each point (P100, P50, P25) and (iii) the probability to choose the option with the highest probability of reward for the three possible “gambles”: G100 = choice of 50% over 25%, G25 = choice of 100% over 50 and G50 = choice of 100% over 25%. (Center) Example of two trajectories obtained from two different mice across a 5 min session showing individualistic strategies where the mouse in the top trace shows a low propensity for changing direction, resulting in a more circular trajectory, while the mouse in the bottom trace shows a high percentage of directional change, focusing on the most rewarded options. (Right) Analysis over concurrent sessions indicates consistent differences in behaviors between mice indicative of low intra-individual variability and high inter-individual variability. Correlation between the percentage of directional changes for two consecutive sessions shows a strong stability between strategy across sessions within individual mice, while behavior between subjects remains variable. (C) Archetypal analysis: (left) Plot of the three archetypal solutions, and their seven basic variables (see B). Left: Visualization of the α coefficients using a ternary plot. Each point represents the projection of an individual onto the plane defined by a triangle where the three apices represent the three archetypes (A1, A2, A3). Points are color-coded according to their proximity to the archetypes. Schematic at the three apices illustrate the main behavior of the three archetypes. A1 corresponds to a mouse that alternates only between p100 and p50. Such a mouse would reach a 75% success rate. In contrast, mice using a purely circular strategy would have a 58.3% success rate. They either turn in a descending manner (A2: sequence p100 – p50 – p25) or an ascending manner (A3: sequence p25 – p50 – p100). Experimental mice fall somewhere within the boundaries of these extreme behaviors. (Modified from Dongelmans et al., 2021).

