
Figure 13.
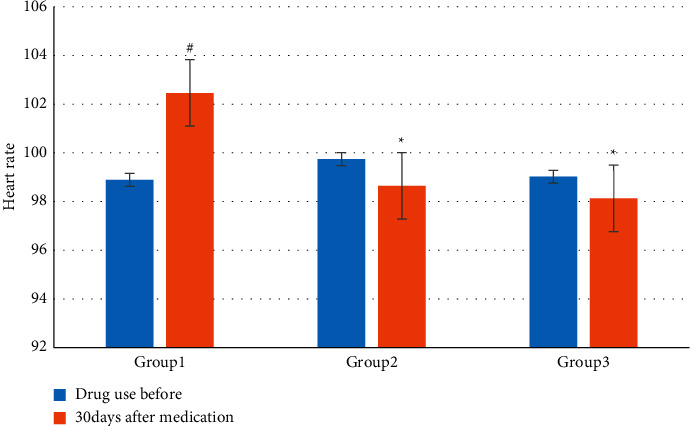
Comparison of heart rate changes among the three groups before and after treatment (∗ represents a statistically significant difference compared with group 1 of sodium nitroprusside, p < 0.05, and # represents a statistically significant difference compared with before treatment, p < 0.05).