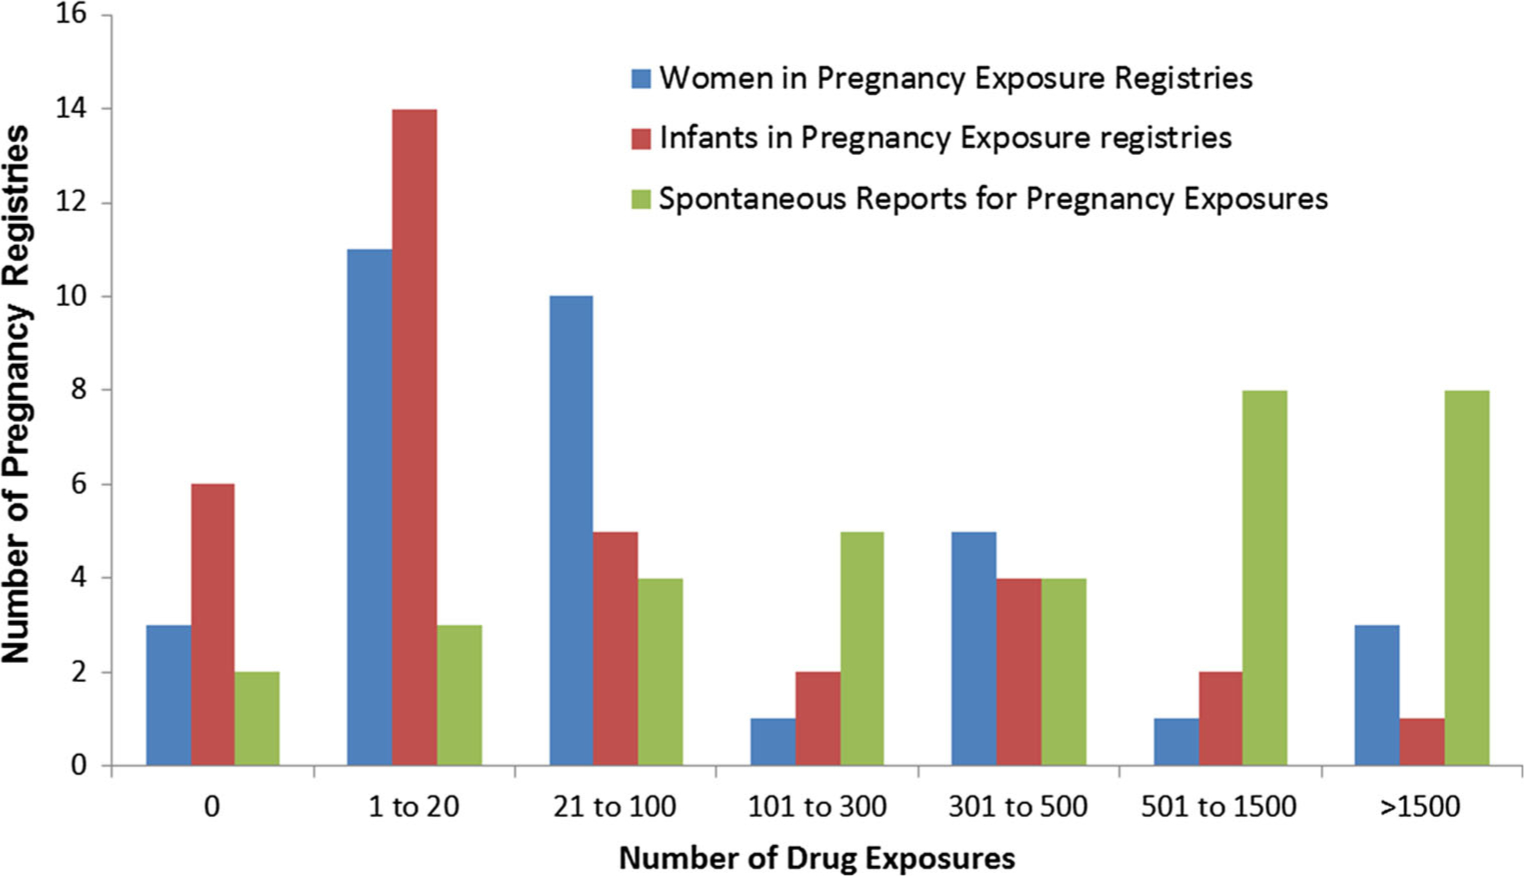
Fig. 2.

Number of pregnancy registries within each range of exposed pregnancies and infants captured (n = 34 total products). This figure represents the number of products with pregnancy registries (total n = 34), and describes the distribution of the number of exposed pregnancies and resultant infants captured, using six discrete categories for the total number of drug exposures. The distributions are provided for a blue bars: women exposed to drug products during pregnancy; b red bar: infants exposed to drug products in utero; and c green bar: spontaneous reports of pregnancy exposure by the sponsor
