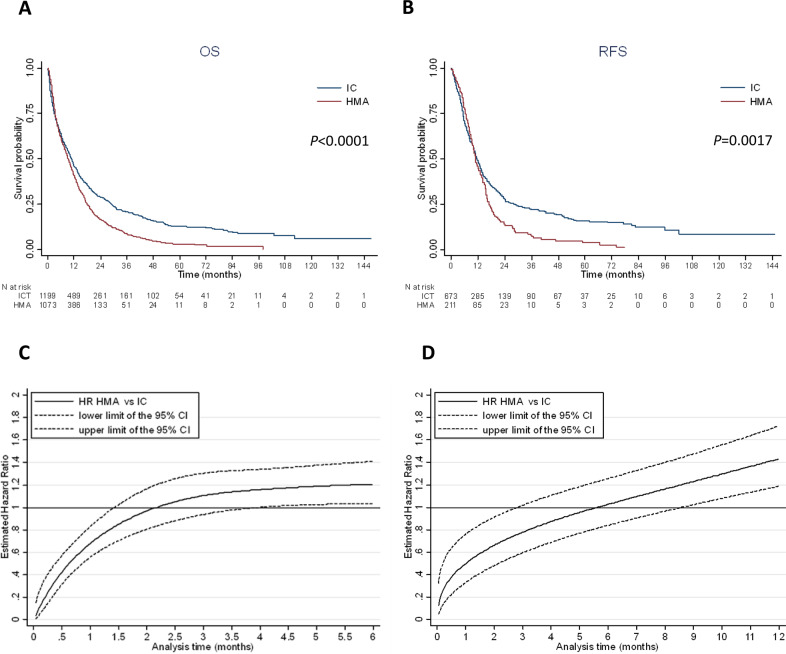
Fig. 2. Survival according to intensive chemotherapy or HMA treatment.
A Kaplan–Meier curve of overall survival according to treatment (median OS: 10.9 months, 95% CI: 9.7–11.6 with IC and 9.2 months, 95% CI: 8.3–10.2 with HMAs). B Kaplan–Meier curve of relapse free survival according to treatment (median RFS: 11.5 months, 95% CI: 10.5–12.7 with IC and 11.0 months, 95% CI: 9.7–12.9 with HMAs). C Royston and Parmar adjusted* hazard ratio for overall survival in HMA vs. IC for each month from diagnosis. Before 1.5 months of follow-up, patients treated with HMAs had a significantly lower risk of death compared to IC patients. Between 1.5 months and 4.0 months of follow-up, there was no significant difference in survival between HMAs and IC patients. From 4.0 months of follow-up, patients treated with HMAs had a significantly higher risk of death compared to IC patients. Interaction between treatment (HMAs vs. IC) and age (< vs ≥75 y), performance status (≤ vs >1), cytogenetic risk (favorable vs. intermediate vs. adverse) or NPM1 mutation (yes vs. no) was not significant, showing that the effect of HMAs vs. IC was not significantly different according to age, performance status, cytogenetic risk and NPM1 mutation. Thus, there is no indication to stratify the analysis on age, performance status, cytogenetic risk and NPM1 mutation (Figure C was the same according to age (< vs. ≥75 y), performance status (≤ vs. >1), cytogenetic risk (favorable vs. intermediate vs. adverse) or NPM1 mutation (yes vs. no)). *Adjusted for age ≥75 y, performance status > 1, white blood cell count at diagnosis >30 giga per liter, cytogenetic risk, secondary vs de novo AML and NPM1 mutation. D Royston and Parmar adjusted* hazard ratio for relapse-free survival in HMAs vs. IC for each month from CR/CRi. Before 3 months of follow-up, patients treated with HMAs had a significantly lower risk of relapse or death compared to IC patients. Between 3 months and 8.5 months from CR/CRi, there was no significant difference between HMAs and IC patients. Beyond 8.5 months from CR/CRi, patients treated with HMA had a significantly higher risk of relapse or death compared to IC patients. Interaction between treatment (HMAs vs. IC) and age (< vs. ≥75 y), performance status (≤ vs. >1), cytogenetic risk (favorable/intermediate vs. adverse) or NPM1 mutation (yes vs. no) was not significant, showing that the effect of HMAs vs. IC was not significantly different according to age, performance status, cytogenetic risk and NPM1 mutation. Thus, there is no indication to stratify the analysis on age, performance status, cytogenetic risk and NPM1 mutation (Figure D was the same according to age (< vs. ≥75 y), performance status (≤ vs. > 1), cytogenetic risk (favorable/intermediate vs. adverse) or NPM1 mutation (yes vs. no)). *Adjusted for performance status >1, white blood cell count at diagnosis >30 giga per liter, cytogenetic risk, secondary vs. de novo AML, NPM1 and FLT3-ITD mutations.

