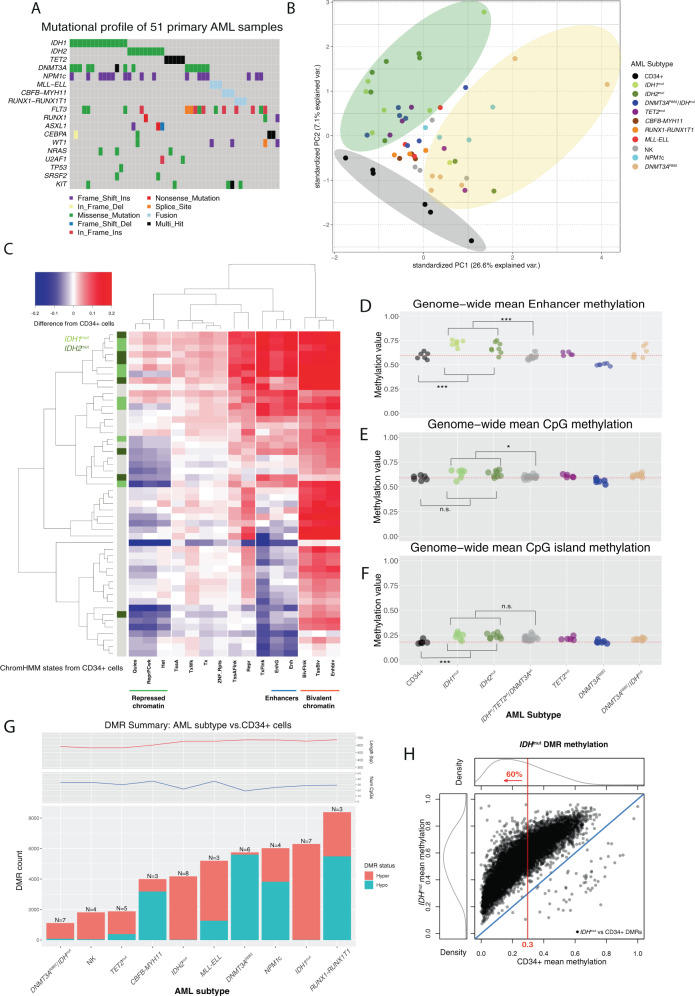
Fig. 1. Genome-wide DNA methylation patterns in 51 primary AML samples and normal CD34+ cells.
A Summary of the mutations in 51 primary AML patients analyzed using whole-genome bisulfite sequencing. B Principal component analysis of genome-wide methylation in AML samples and CD34+ cells. Points show the values of the first and second principal components by variance explained from an analysis of genome-wide methylation summarized in mean methylation in 1 kb bins, with colors representing the defining mutation for each sample. Stratification of IDHmut samples from CD34+ cells and AML samples with DNMT3AR882 mutations are highlighted by colored ellipses. C Two-way hierarchical clustering of relative (difference from CD34+ cells) mean methylation levels in genomic regions defined by 15 chromatin states [36] in CD34+ cells, where rows are AML samples and columns are chromatin states. Blue is less methylated than CD34+ cells and red is more methylated. IDH1 and IDH2 mutation status are indicated in the colored bar on the left, and selected chromatin states are shown underneath the panel. D Mean methylation levels in the enhancer chromHMM state (derived from publicly available CD34+ epigenetic data) from WGBS for CD34+ cells (N = 6) and AML subtypes (IDH1mut or IDH2mut, n = 15; TET2mut, n = 5; DNMT3AR882, n = 6; DNMT3AR882/IDHmut, n = 7; normal karyotype with NPM1c and wild-type IDH1, IDH2, TET2, and DNMT3A, n = 4; Normal karyotype with wild-type NPM1, IDH1, IDH2, TET2, and DNMT3A, n = 4; CBFB-MYH11, n = 3; MLL-ELL, n = 3; RUNX1-RUNX1T1, n = 3). E Mean methylation levels for ~28 million genome-wide CpGs in CD34+ cells and AML subtypes. F Mean methylation at CpG islands in CD34+ cells and AML subtypes. G Number of differentially methylated regions (DMRs) identified for each AML subtype compared with normal CD34+ cells. Teal and orange bars represent hypomethylated and hypermethylated DMRs with respect to normal CD34+ cells, respectively. Mean number of CpGs per DMR (top panel) and DMR length (bottom panel) are shown for each AML subtype. H Mean methylation in IDHmut DMRs in IDHmut samples versus CD34+ cells. The red line indicates the percent of all DMRs with mean methylation in CD34+ cells <0.3.

