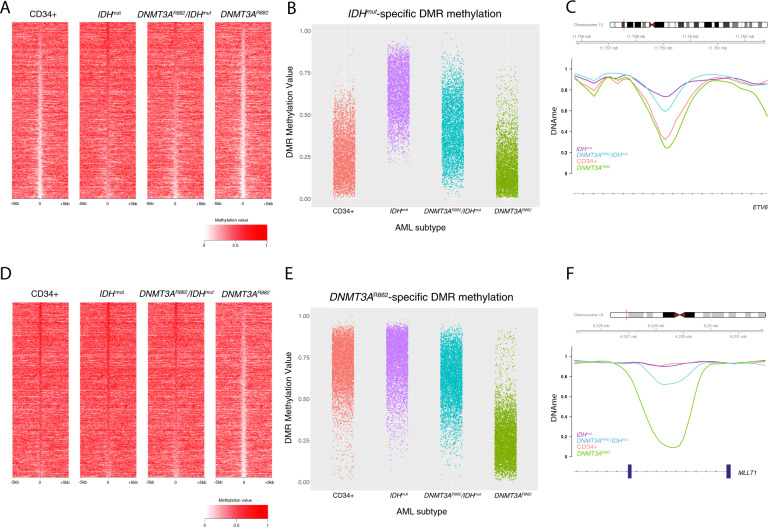
Fig. 4. DNMT3AR882/IDHmut double mutant AMLs display an attenuated focal hypermethylation phenotype.
A Locus heatmap of mean methylation at IDHmut DMRs (rows) in IDH1 or IDH2 mutant, DNMT3AR882/IDHmut double mutant, and DNMT3AR882 AMLs, and CD34+ cells. B Distribution of IDHmut-specific DMR methylation levels by AML subtype. C Example IDHmut-specific DMR locus within the ETV6 gene demonstrating an intermediate methylation phenotype of double mutant samples with respect to IDHmut and DNMT3AR882 mutant AMLs. D Methylation locus heatmap of average subtype methylation across DNMT3AR882 DMRs called vs. CD34+ cells in IDHmut, DNMT3AR882/IDHmut double mutant, and DNMT3AR882 AMLs, and CD34+ cells. E Distribution of DNMT3AR882 DMR methylation levels by AML subtype. F Example DNMT3AR882 DMR locus within the MLLT1 gene, demonstrating the hypomethylation phenotype of DNMT3AR882 mutant samples with respect to IDHmut and DNMT3AR882/IDHmut double mutant AML samples.

