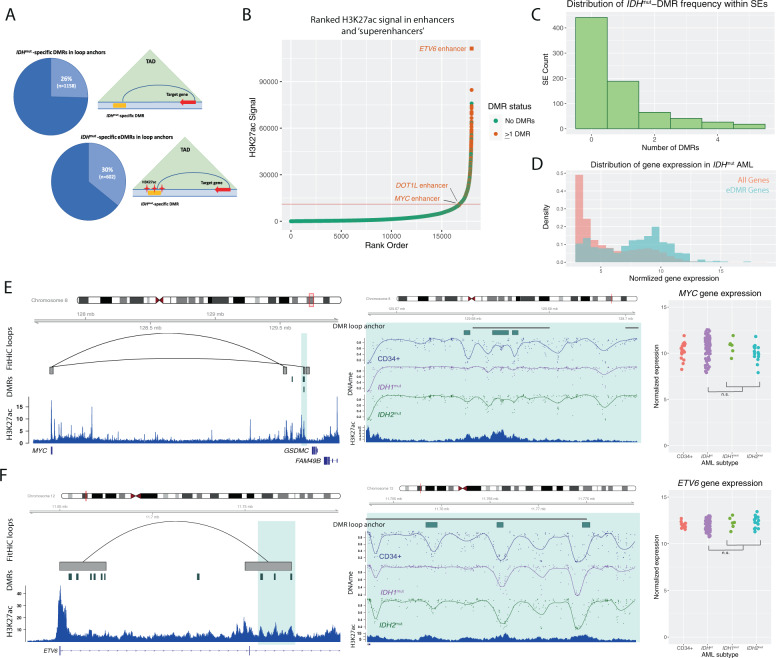
Fig. 6. IDHmut-specific DMRs are enriched in superenhancers and interact with highly expressed genes in AML.
A Schematic of a DMR and an enhancer-associated DMR (eDMR) and their interaction with target genes based on intersection HiC-defined genome loops. B Rank ordered enhancer regions based on H3K27ac signal in a representative IDHmut AML sample, annotated by the presence of overlapping IDHmut-specific DMRs (absence of DMRs indicated by green points, greater than one DMR indicated by orange points) and computationally-defined “superenhancer” (above the red line). Enhancers of specific hematopoietic genes are labeled. C Distribution of the number of IDHmut-specific DMRs overlapping a set of AML consensus superenhancers from H3K27ac data from four primary samples (N = 779). D Distribution of normalized gene expression values for all expressed genes (orange histogram) and a set of 750 eDMR target genes (blue histogram) in IDHmut AML samples. E Example IDHmut-eDMR locus displaying interactions with the MYC promoter. A zoomed-in view of the locus demonstrates focal enhancer hypermethylation in IDH1mut (purple) and IDH2mut (green) samples compared with CD34+ cells (blue). Normalized MYC expression is shown for 17 CD34+ cord blood cell samples, 6 and 14 IDH1mut and IDH2mut samples, and 91 IDHwt samples. F Example IDHmut-DMR locus in a candidate enhancer that displays robust interactions with the ETV6 promoter. A zoomed-in locus view demonstrates focal enhancer hypermethylation in IDH1mut (purple) and IDH2mut (green) samples compared with CD34+ cells (blue). Normalized ETV6 expression is shown for CD34+ cells, IDH1mut, and IDH2mut samples, and IDHwt samples (see E for sample sizes).

