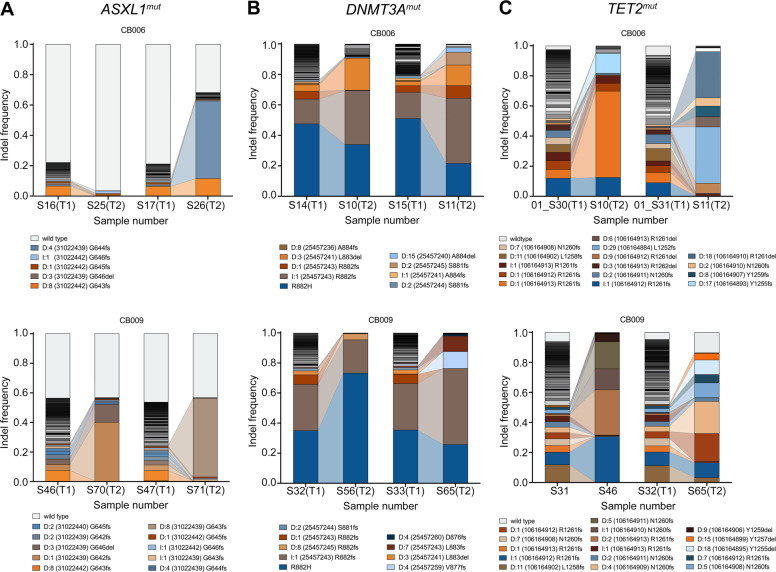
Fig. 5. Expansion of distinct cell clones in long-term culture.
Representative examples of two replicates of two independent cord blood samples (CB006 and CB009) after 7d and long-term culture. Distribution of mutations in (A) ASXL1mut, (B) DNMT3Amut, and (C) TET2mut are shown before (T1) and after (T2) long-term culture. Different colors represent different mutations. Only the most prominent mutations are labelled. In Figs. S11, S12, S13 all replicates are shown.

