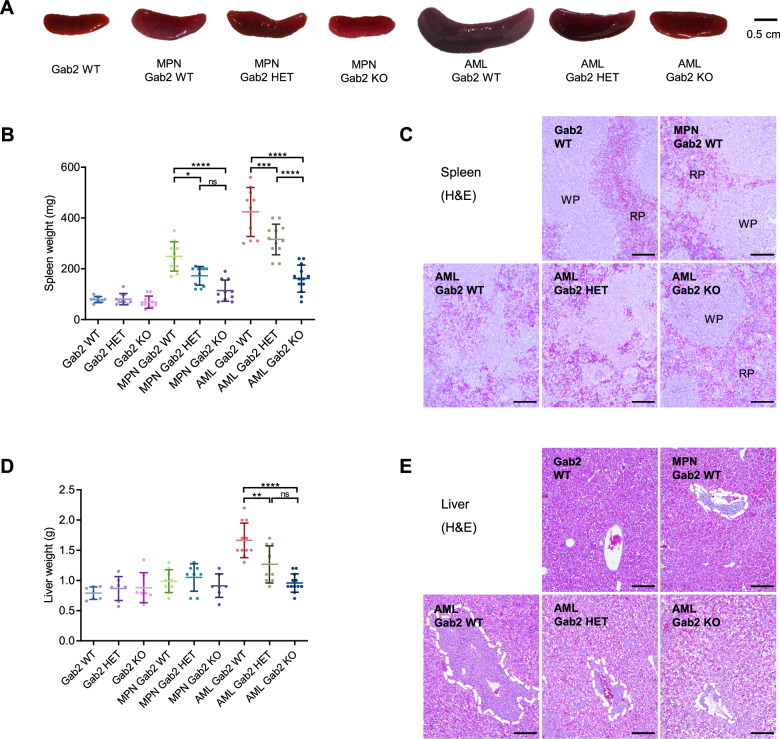
Fig. 2. Gab2 KO protects from disease-associated changes in spleen and liver weight as well as histology in AML mice.
A Exemplary spleen images of mice with the indicated genotypes. Effect of the Gab2 genotype on (B) spleen and (D) liver weight of control, MPN and AML mice. Graphs show individual values for all the analyzed mice with mean ± SD. Data were analyzed using one-way ANOVA with Tukey’s multiple comparison test; ns not significant; *P < 0.05; **P < 0.01; ***P < 0.001; ****P < 0.0001. Only selected significances are indicated, a full list of all P values can be found in Supplementary Table 1. Representative hematoxylin and eosin (H&E) stains of (C) spleen and (E) liver sections from mice with the specified genotypes. Scale bars: 400 µm; RP = red pulp, WP = white pulp. In (E), perivascularily invading cells were marked with a dashed line. A–E All analyzed mice were between 21 and 30 days old.

