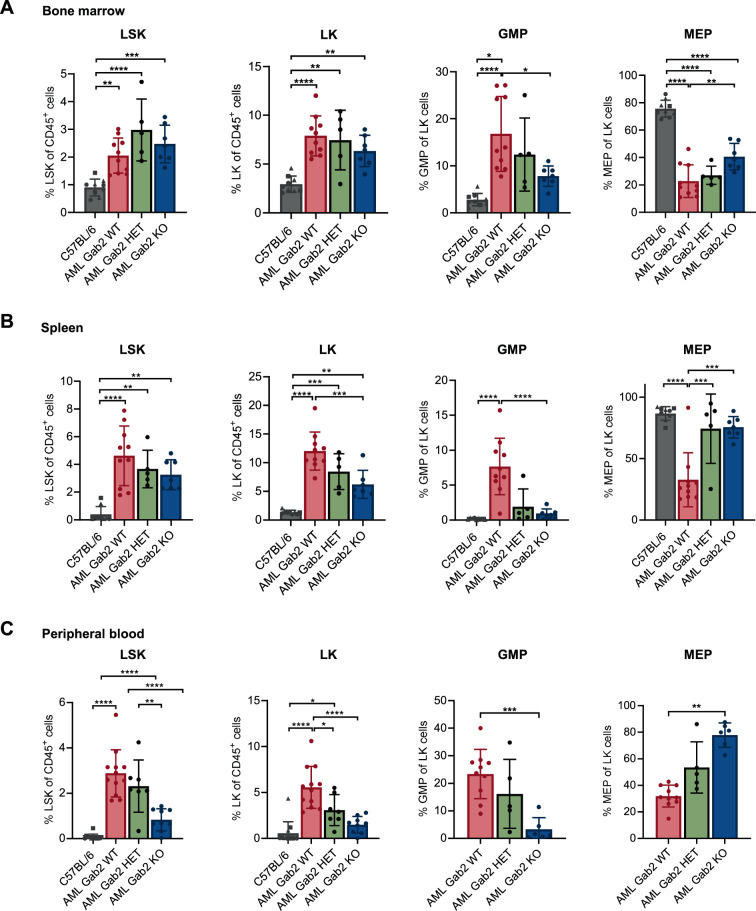
Fig. 3. Gab2 deficiency affects the proportion of progenitor cell populations in the PB, spleen and BM in AML mice.
Flow cytometry of the (A) BM, (B) spleen and (C) PB of AML mice with the indicated Gab2 genotypes. C57BL/6 mice served as healthy controls being Gab2 proficient (circle), haploinsufficient (triangle) and deficient (square), respectively. All analyzed mice were aged between 21 and 30 days. Shown are the proportions of LSK (Lin− Sca-1+ c-Kit+) and LK cells (Lin− Sca-1− c-Kit+) from CD45+ cells as well as the proportion of GMP (Lin− c-Kit+ Sca-1− CD34+ CD16/32+) and MEP (Lin− c-Kit+ Sca-1− CD34− CD16/32−) cells from LK cells. Note that in (C) due to the very low frequency of LK cells in the PB no values for MEP and GMP cells in healthy control mice are depicted. Graphs show individual values for all the analyzed mice with mean ± SD. Statistics were calculated using a one-way ANOVA with Tukey’s multiple comparison test; *P < 0.05; **P < 0.01; ***P < 0.001; ****P < 0.0001. Representative flow cytometry blots for every analysis can be found in Supplementary Fig. 3.

