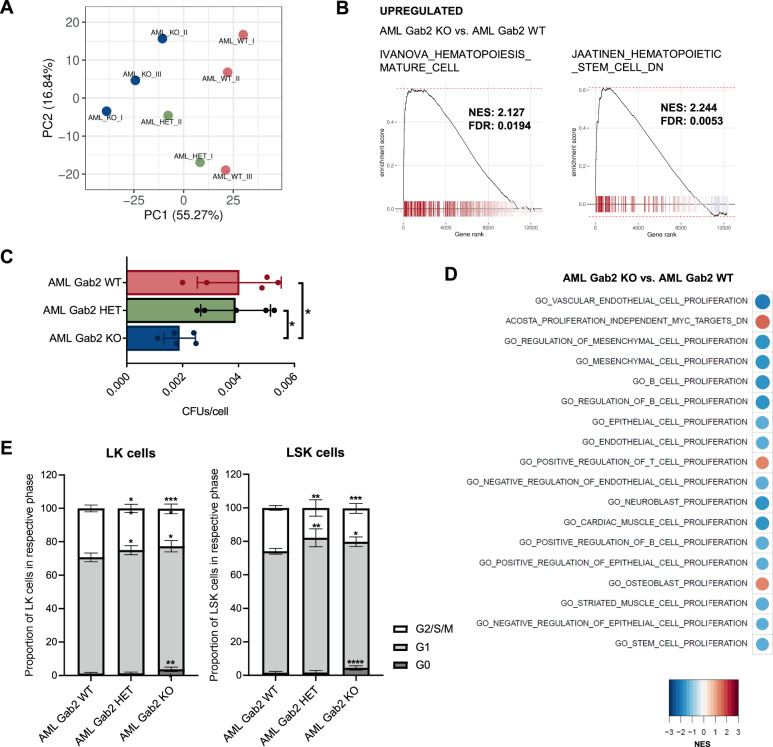
Fig. 5. RNA-seq analysis corroborates the impact of Gab2 deficiency on AML BM.
A Principal component analysis was performed for RNA-seq data of whole BM isolated from AML WT, HET and KO mice, respectively. The top 10% most variable genes, based on median absolute deviation, were used. Note that the groups clearly separate according to principal component (PC) 1. B GSEA was carried out for AML KO versus AML WT BM. Left: Genes upregulated in mature blood cell populations are enriched in AML KO compared to AML WT BM. Right: Genes downregulated in HSCs are upregulated in AML KO versus AML WT BM. NES: Normalized enrichment score; FDR: False discovery rate. C CFU assays were performed in technical duplicates with BM isolated from AML WT, HET and KO mice, respectively. Bars represent mean ± SD; every dot corresponds to the BM of one particular mouse. D GSEA for AML KO versus AML WT BM. Shown are enrichment heat maps for gene sets with an adjusted p value < 0.5 containing the keyword ‘proliferation’. Color code and circle size correspond to the NES. E BM with the indicated genotypes was stained with Ki-67 and DAPI and subsequently subjected to cell cycle analysis via flow cytometry. G2/S/M phase was defined as Ki-67 and DAPI double-positivity, while cells in G1 phase were Ki-67 single positive and cells in G0 phase negative for both markers. Shown are the results for LK (left) and LSK (right) cells. At least 8 mice per genotype were analyzed. The experiment was repeated twice and results were pooled. Mean ± SD are shown. C, E Significance was determined by one-way ANOVA with Tukey’s multiple comparison test; *P < 0.05; **P < 0.01; ***P < 0.001; ****P < 0.0001.

