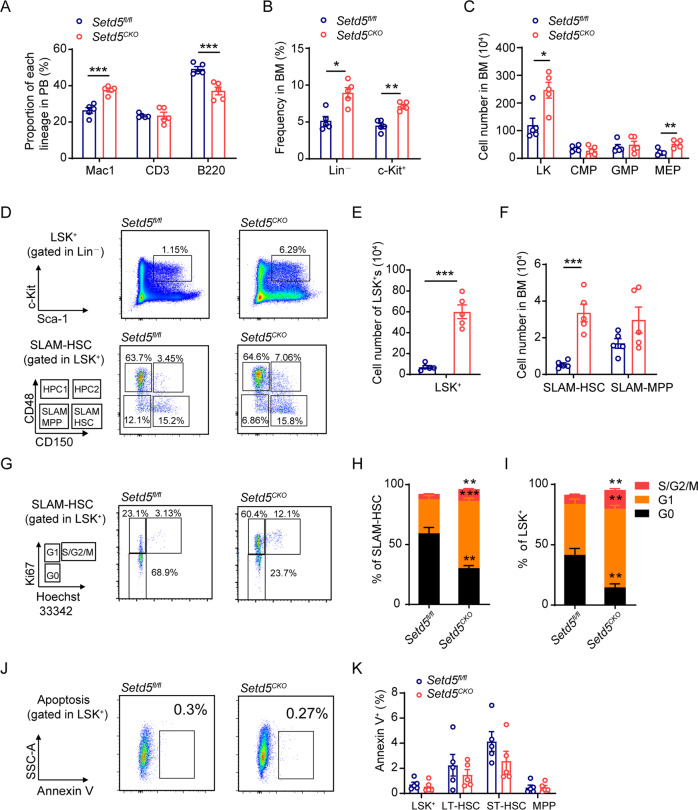
Fig. 1. Setd5 deficiency causes phenotypic HSPC expansion.
A FACS analysis of T, B, and myeloid cells frequency in PB cells; n = 5. B Relative frequency of immature cells (Lin– and c-Kit+) in BM. Lin: lineage cocktail; n = 5. C The absolute cell number of HPC (LK: Lin–c-Kit+Sca-1–), CMP (Lin–c-Kit+Sca1–CD34+CD16/32low), GMP (Lin–c-Kit+Sca1–CD34+CD16/32high) and MEP (Lin–c-Kit+Sca1–CD34–CD16/32low) populations in Setd5fl/fl and Setd5CKO mice; n = 5. D–F FACS analysis of LSK+s (Lin–Sca1+c-Kit+) and SLAM-HSCs (Lin–Sca1+c-Kit+CD150+CD48–) and absolute cell number in BM. SLAM-MPP: Lin–Sca1+c-Kit+CD150–CD48–, HPC1: Lin–Sca1+c-Kit+CD150–CD48+, HPC2: Lin–Sca1+c-Kit+CD150+CD48+; n = 5. G Representative FACS profiles of Ki67 staining of SLAM-HSCs. H, I The frequencies of G0, G1, S/G2/M phases in SLAM-HSCs and LSK+s are shown; n = 4. J, K Apoptosis analysis of HSPCs in Setd5fl/fl and Setd5CKO mice, LT-HSC: Lin–Sca1+c-Kit+CD34–Flt3low, ST-HSC: Lin–Sca1+c-Kit+CD34+Flt3low, MPP: Lin–Sca1+c-Kit+CD34+Flt3+; n = 5. Data are represented as mean ± SEM. * P < 0.05, ** P < 0.01, *** P < 0.001.

