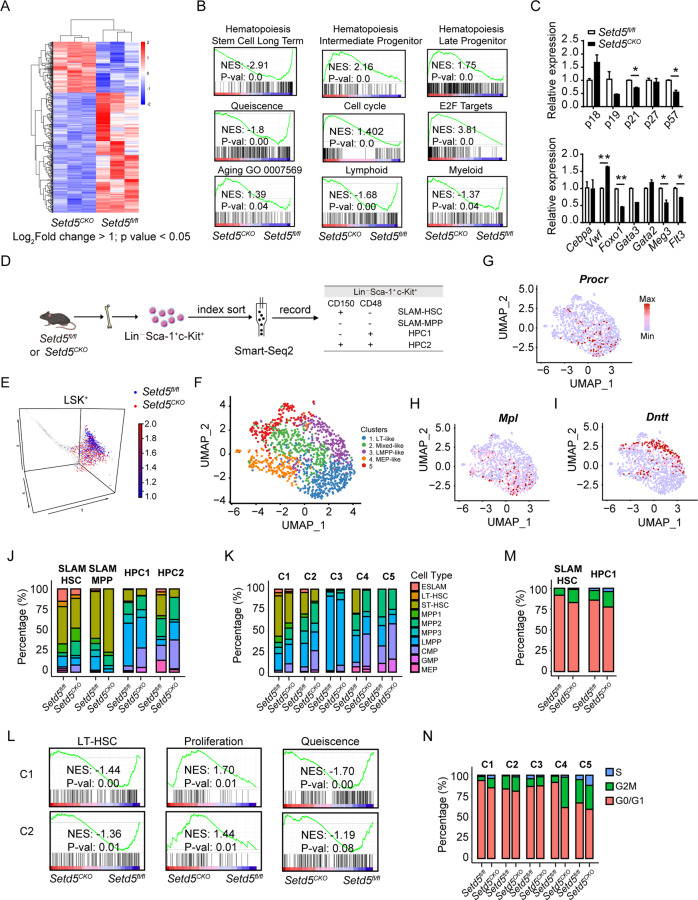
Fig. 4. Transcriptome profiling of Setd5-deficient HSCs reveals altered stem cell property and cell cycle signature.
A Heat map showing differential expression of 443 genes in Setd5fl/fl and Setd5CKO SLAM-HSCs, |Log2foldchange | > 1, p value < 0.05; n = 3. B GSEA analyses for genes affected in the SLAM-HSCs of Setd5fl/fl and Setd5CKO mice. NES, normalized enrichment score. C Relative expression levels of cell cycle and multi-potency genes in HSC cells; n = 3. mRNA levels were normalized to the expression of 18 s. D. Experimental design for single cell sequencing with Smart-seq2, LSK+ cells were indexed sorted into 96-well plates containing lysis buffer. E LSK+ cells were projected onto Nestorowa et al. data [30]. F UMAP visualizations of single cell transcriptomes of identified clusters using Seurat. G–I Diffusion maps of all cells were colored according to the expression levels of selected genes. J, K Histograms showing the compositions of surface markers defined four populations and transcriptome-defined five clusters by ten cell types annotated with Nestorowa et al. data. C1-C5 means cluster 1-5. Ten annotated cells including E-SALM (EPCR+CD48–CD150+), LT-HSC (Lin–Sca1+c-Kit+CD34–Flt3low), ST-HSC (Lin–Sca1+c-Kit+CD34+Flt3lowCD48–CD150–), MPP1 (Lin–Sca1+c-Kit+CD34+Flt3lowCD48–CD150+), MPP2 (Lin–Sca1+c-Kit+CD34+Flt3lowCD48+CD150+), MPP3 (Lin–Sca1+c-Kit+CD34+Flt3lowCD48+CD150–), LMPP (Lin–Sca1+c-Kit+CD34+Flt3+), CMP, GMP and MEP. L GSEA of LT-HSC, proliferation and quiescence signatures comparing between Setd5CKO and Setd5fl/fl in HSC enriched cluster 1 and cluster 2. M, N Proportion of SLAM-HSCs, HPC1s and five clusters identified with Seurat in each of the cell cycle stages between two groups.

