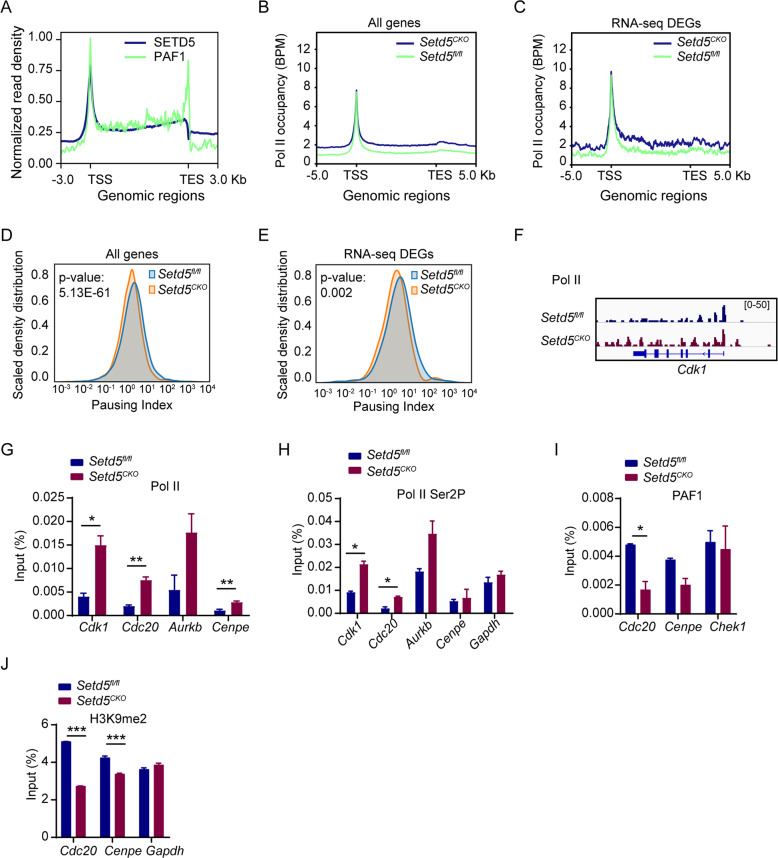
Fig. 6. SETD5 regulates the promoter-proximal paused Pol II release on E2F targets.
A Density plots of SETD5 (blue) and PAF1 (green) normalized ChIP-seq signals. B, C Occupancy of total Pol II on all genes and DEGs (Fold change>1.5 and p adj value<0.05), ChIP normalization was implemented by integrating Spike-in Chromatin. D, E Density plot of all genes and DEGs with reduced average Pol II pausing index in Setd5CKO. F IGV tracks comparing occupancy of Pol II within Cdk1 locus. G, H ChIP-qPCR of Pol II and Pol II Ser2P at the promoters of indicated genes in c-Kit+ cells from control or Setd5CKO mice; n = 2. I ChIP-qPCR analysis of PAF1 at the promoters of indicated genes in c-Kit+ cells; n = 2. J The H3K9 dimethylation levels at Cdc20 and Cenpe promoters; Gapdh as an internal control; n = 2. Mean ± SEM; *P < 0.05, **P < 0.01, *** P < 0.001.

