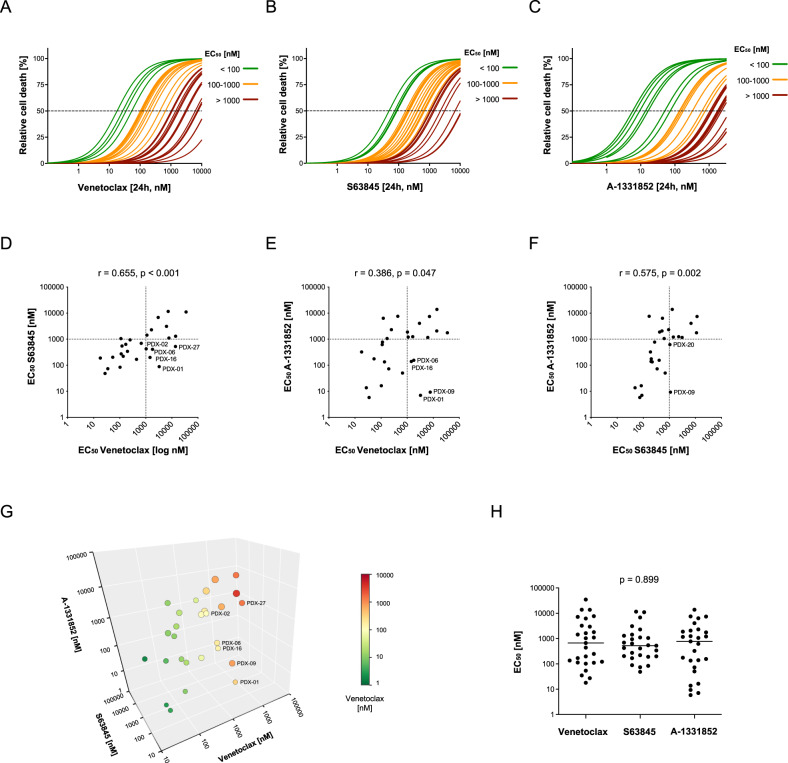
Fig. 2. Side-by-side analysis of venetoclax, S63845, and A-1331852 in BCP-ALL xenograft samples.
Cell death rates were assessed by flowcytometry according to forward and side scatter criteria following exposure of primary BCP-ALL xenograft samples for 24 h to triplicates of increasing concentrations (1, 5, 10, 50, 100, 250, 500 nM, 1, 5 and 10 µM) of (A) venetoclax, (B) S63845 or (C) A-1331852. The EC50 curves are color-coded as indicated in the legend. D–F Association of the EC50 values of venetoclax, S63845, and A-1331852. Spearman correlation; r, correlation coefficient; p, significance. G 3D scatter plot showing an association of the EC50 values of venetoclax, S63845, and A-1331852. Samples which are insensitive to venetoclax (EC50 > 1 µM) but that are sensitive to at least one of the other two inhibitors are labeled in the graph. The colors of the symbols represent the EC50 values of venetoclax as indicated in the legend and the sizes indicate the EC50 values of S63845. H Scatter plot of the EC50 values of the three inhibitors with individual data points of single PDX samples and medians (lines). Kruskal-Wallis test; p, significance.

