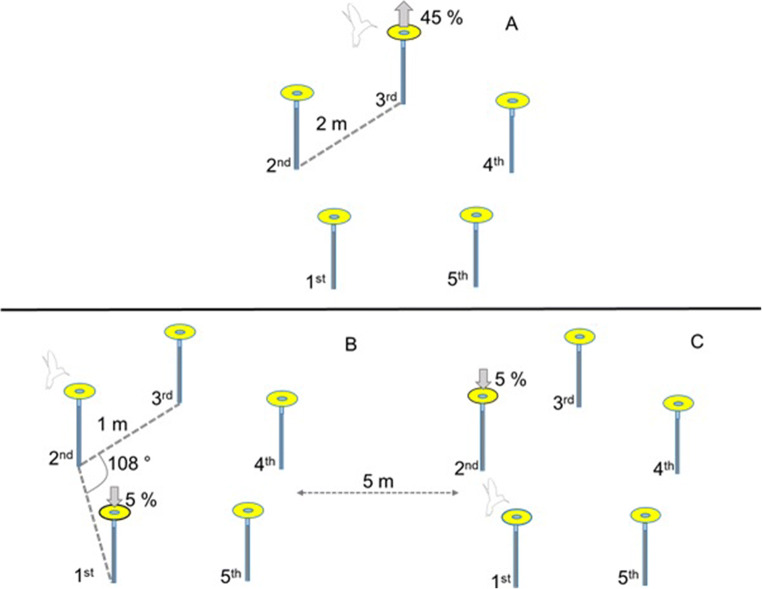
Fig. 1.
Diagram of the experimental protocol for the second phase of the three experiments. The five artificial flowers were arranged in a pentagon, with flowers 2 m apart for Experiment 1 and 1 m in Experiments 2 and 3. During Phase 1 of each experiment, all flowers were equally rewarded with the same amount of 25% sucrose solution. During Phase 2, however, we increased or lowered the sucrose concentration of one of the flowers. A In Experiment 1, we increased the concentration of the flower most likely to be visited in third place during Phase 1. B In Experiment 2, we decreased the concentration of the sucrose from 25% to 5% in the flower that was visited most often first during Phase 1. C In Experiment 3, we decreased the sucrose concentration of the flower visited most often in second place during Phase 1

