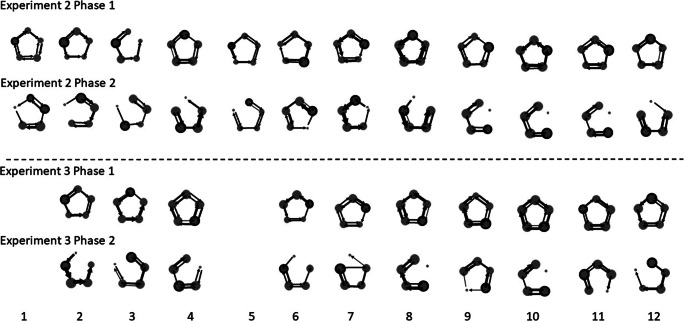
Fig. 4.
Markovian chain transition diagrams for each bird (numbers from 1 to 12) for each phase of each experiments 2 and 3 (e.g., Experiment 2, Phase 1). The arrows represent the transitions that the bird made significantly more frequently than at chance (p < .05, where the Z score >1.96). The arrows are also proportional to the size of the score: the wider the arrow, the larger the score. The circle size is proportional to the frequency of visits it represents. Circles with black outlines represent the flowers that were visited more often in first place

