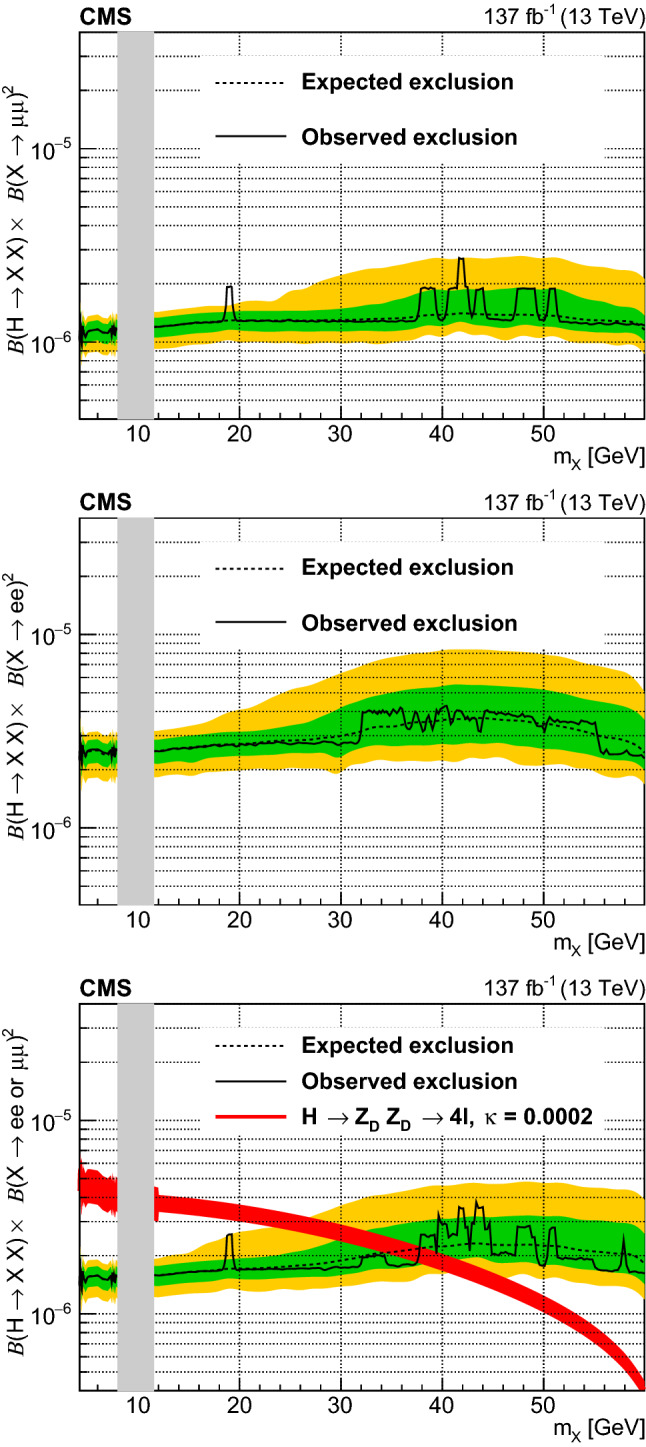
Fig. 5.

Expected and observed 95% CL limits on assuming decays to dimuons only, assuming decays to dielectrons only, and assuming a flavor symmetric decay of to dimuons and dielectrons. The dashed black curve is the expected upper limit, with one and two standard-deviation bands shown in green and yellow, respectively. The solid black curve is the observed upper limit. The red curve represents the theoretical cross section for the signal process . The discontinuity at 12 in uncertainty is due to the switch from experimental to theoretical uncertainty estimates of , as described in Ref. [7]. The symbol is the Higgs-mixing parameter. The grey band corresponds to the excluded region around the bound states of
