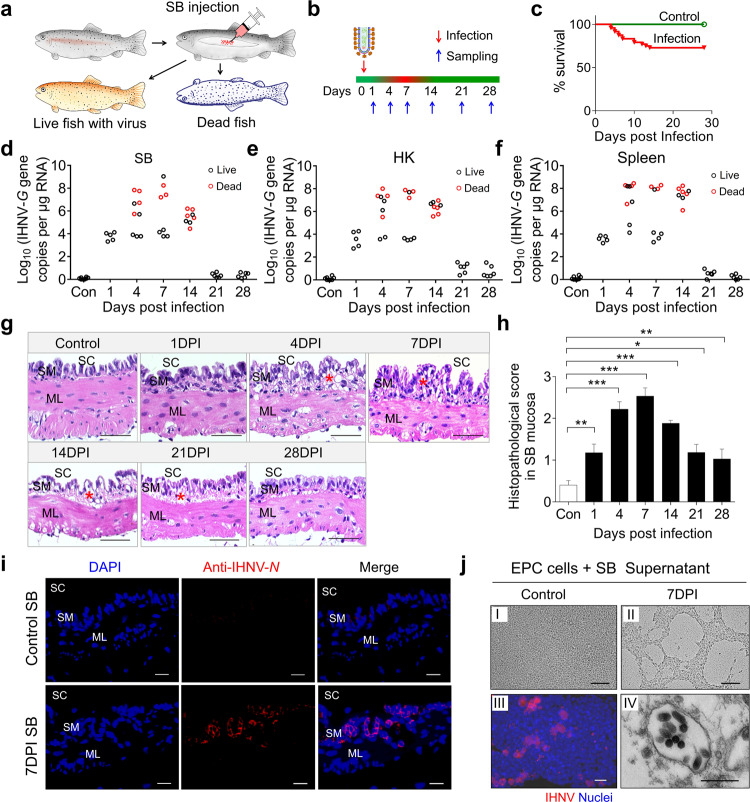
Fig. 2. Infection model of SB with IHNV.
a, b Trout were injected with 25 μL (1 × 10⁵ TCID50) of virus solution via intra-SB injection, and subsequently sacrificed at 1, 4, 7, 14, 21, and 28 DPI for tissue sample collection. The red color on the timeline represents dead fish or diseased fish which have symptoms of viral infection (i.e., slow swimming speed and inactive feeding when compared to control fish) while the green color represents normal behavior of a healthy fish. c Cumulative survival of control and IHNV-infected fish. d–f IHNV-G gene copies (Log10) were quantified using qPCR in fish tissues collected at 1, 4, 7, 14, 21, and 28 DPI. The virus was detected in the fish SB (d), head kidney (HK) (e), and spleen (f). Each circle represents one fish; red circles represent dead fish while black circles represent live fish. g Histological examination of SB from control fish and trout infected with IHNV at 1, 4, 7, 14, 21, and 28 DPI (n = 5–9). Red asterisks indicate the damage in SM. SC SB cavity, SM SB mucosa, ML muscle layer. Scale bars, 50 μm. h Pathology score of SB mucosa from control and infected fish. i Immunofluorescence staining of IHNV in SB paraffin-sections from control and 7 days infected fish (n = 5–11). IHNV (red) is stained with an anti-IHNV-N mAb; nuclei were stained with DAPI (blue). SC SB cavity, SM SB mucosa, ML muscle layer. Scale bars, 20 μm. j Cytopathic effect of IHNV on epithelioma papulosum cyprini (EPC) cells after culture with the supernatant of SB homogenates from control (j I) and the 7-day infected fish (j II). Immunofluorescence staining of IHNV using the anti-IHNV-N mAb, nuclei were stained with DAPI (blue) (j III). Electron microscope (EM) analysis of viral particles within EPC cells (j IV) from j II. Scale bars, 100 μm in j I and j II, 20 μm in j III, 500 nm in j IV. Statistical differences were evaluated by unpaired Student’s t-test. Data in h are representative of at least three independent experiments (mean ± SEM). *P < 0.05, **P < 0.01, and ***P < 0.001.

