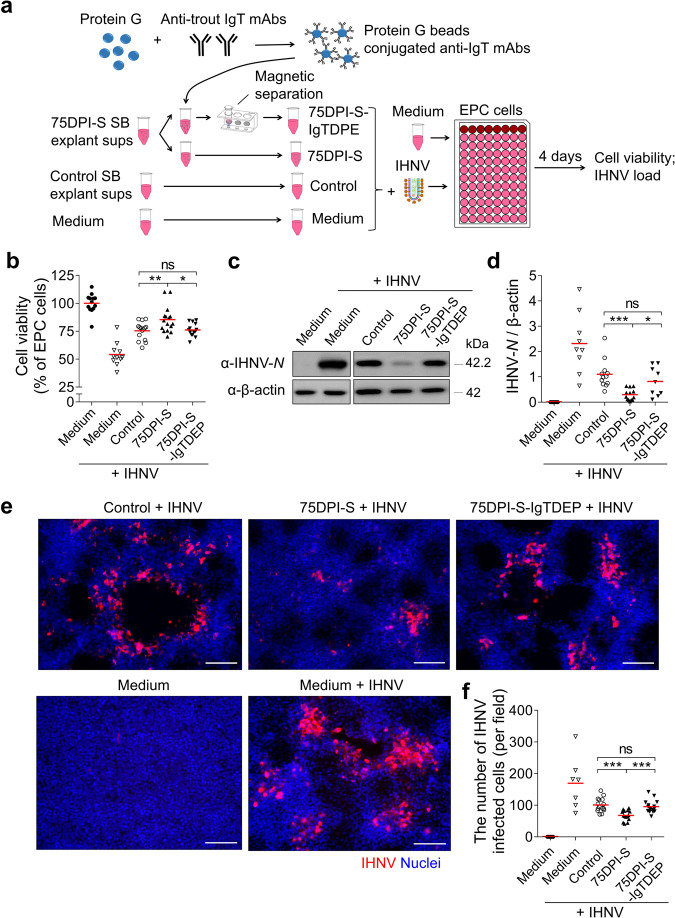
Fig. 6. Viral neutralization exerted by IHNV-specific sIgT from SB of 75DPI-S fish.
a Scheme of the experimental strategy. Magnetic protein G beads were incubated with anti-trout IgT mAbs to generate protein G beads coated with anti-IgT mAbs. SB explant supernatants (sups) from control and 75DPI-S fish were collected after 3 days incubation with MEM medium. IgT from 75DPI-S SB explant sups was depleted by incubating these sups with protein G beads coated with anti-IgT mAbs. Thereafter, IHNV was pre-incubated with medium alone or SB explant sups derived from control, 75DPI-S, or 75DPI-S-IgTDEP fish, and each of these IHNV-containing sups were added to EPC cells. Four days after addition of the different SB explant sups or medium alone to EPC cells, these five groups of EPC cell treatments (including: Medium (EPC cells), Medium + IHNV (IHNV-EPC cells), Control (control sups-IHNV-EPC cells), 75DPI-S (75DPI-S sups-IHNV-EPC cells), and 75DPI-S-IgTDPE (75DPI-S-IgTDPE sups-IHNV-EPC cells)) were analyzed for EPC cell viability and presence of IHNV-N protein. b The cell viability in the different groups were measured by the colorimetric alamarBlue assay and presented as relative values to those of EPC cells (n = 10–16). c The IHNV-N protein expression in EPC cells was detected by western blot using an anti-IHNV-N mAb. d Relative expression of IHNV-N protein in EPC cells was evaluated by densitometric analysis of immunoblots and presented as relative values to those of control fish (n = 9–13). e The IHNV-N protein in EPC cells was detected by immunofluorescence using the anti-IHNV-N mAb (Isotype-matched control antibody staining is shown in Supplementary Fig. S2c). Scale bars, 100 μm. f Numbers of virally infected cells were calculated from e (n = 7–15). Each symbol (b, d, f) represents an individual fish; small horizontal red lines (b, d, f) indicate the means. Statistical differences were evaluated by one-way ANOVA with Bonferroni correction. Data in b, d, and f are representative of at least three independent experiments (mean ± SEM). *P < 0.05, **P < 0.01, and ***P < 0.001.

