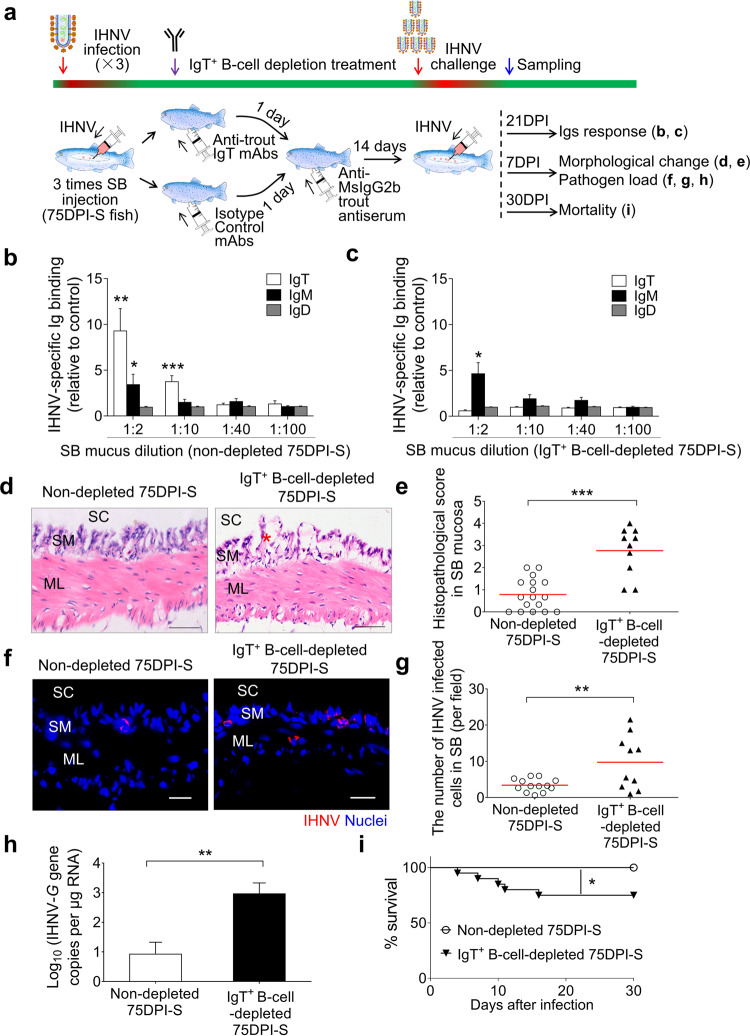
Fig. 7. IgT+ B-cell depletion in fish significantly increases SB viral load and fish mortalities upon IHNV infection.
a Scheme of the experimental strategy. Briefly, immune fish (fish that survived monthly IHNV infections via SB injection, during a 3-month period (75DPI-S fish)) were injected with either isotype (mouse IgG2b) control Abs (non-depleted 75DPI-S fish) or anti-IgT mAb (IgT+ B-cell-depleted 75DPI-S fish). One day later, fish were injected with anti-mouse IgG2b trout antiserum. At 14 days after trout antiserum injection, the non-depleted 75DPI-S and IgT+ B-cell-depleted 75DPI-S groups were infected by intra-SB injection with IHNV (25 μL, 1 × 10⁷ TCID50), and at 21, 7, and 30 DPI, the two fish groups were analyzed for Ig responses, morphological SB changes and SB viral load, and mortalities, respectively. b, c IgT-, IgM-, and IgD-specific binding to IHNV in dilutions of SB mucus from non-depleted (b) and IgT+ B-cell-depleted (c) 75DPI-S fish at 21 DPI. Results are presented as relative values to those of the SB mucus from uninfected naive fish (n = 8–12). d H&E staining of trout SB from non-depleted and IgT+ B-cell-depleted 75DPI-S fish at 7 DPI. Red asterisk indicates the damage in SM. Scale bars, 50 μm. SC SB cavity, SM SB mucosa, ML muscle layer. e Pathology score of SB mucosa in non-depleted and IgT+ B-cell-depleted 75DPI-S fish at 7 DPI. f IHNV protein was detected by anti-IHNV-N protein mAb (red) in SB mucosa from non-depleted (left) and IgT+ B-cell-depleted (right) 75DPI-S fish at 7 DPI. Nuclei were stained with DAPI (blue). SC SB cavity, SM SB mucosa, ML muscle layer. Scale bars, 20 μm. g The number of virally stained cells in SB mucosa of non-depleted and IgT+ B-cell-depleted 75DPI-S fish upon challenge with IHNV counted from f. h Upon challenge, IHNV-G gene copies (Log10) was quantified using qPCR in SB from non-depleted and IgT+ B-cell-depleted 75DPI-S fish at 7 DPI (n = 10). i Cumulative survival of non-depleted and IgT+ B-cell-depleted 75DPI-S fish infected with IHNV. Each symbol (e, g) represents an individual fish; small horizontal red lines (e, g) indicate the means. Statistical differences were evaluated by unpaired Student’s t-test (b, c, e, g, h) and log-rank (Mantel-Cox) test (i). Data are representative of at least three independent experiments (mean ± SEM). *P < 0.05, **P < 0.01, and ***P < 0.001.

