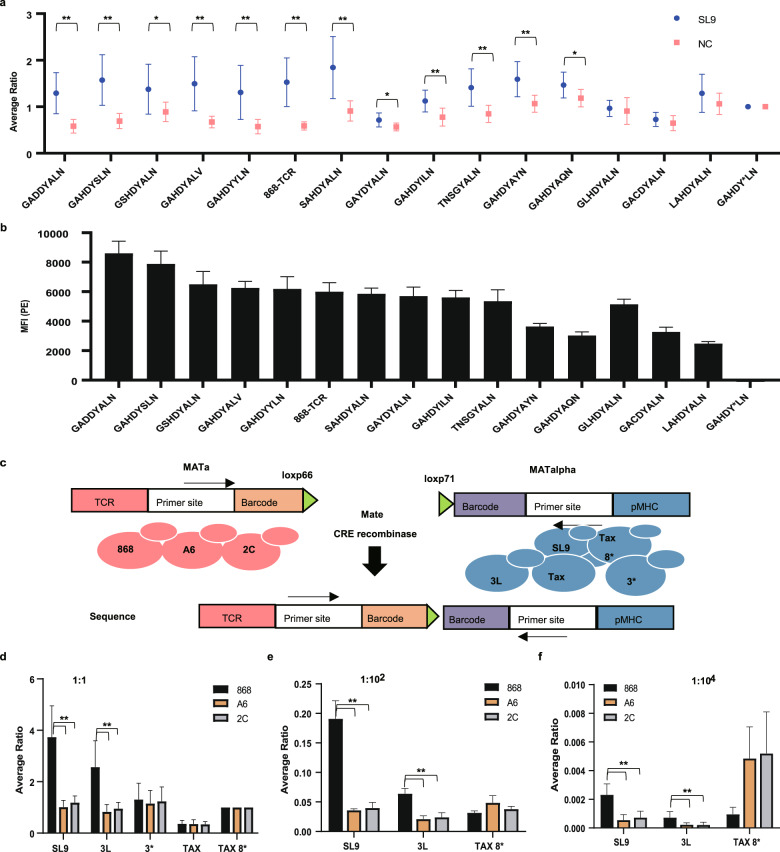
Fig. 4. YAMTAD system for cognate TCR screening and library-on-library screening.
a Ratios (mean ± sd) of the 868 TCR mutants to the GAHDY*LN TCR in diploid yeasts induced in the YAMTAD screening. The NC peptides include TAX and 3*. Each experiment was performed with 4 technical repeats and was independently duplicated 2 times. The mean of 8 duplicates is shown. b The median MFI (mean ± sd) of the indicated 868 TCR mutants stained with PE fluorescently labeled SL9-HLA-A*02:01 tetramer. c A schematic diagram of the barcoding strategy used in library-on-library screening. A unique barcode was added to each TCR or pMHC strain. Expression of Cre recombinase induces recombination between the loxp 66 and loxp 71 sites, resulting in a juxtaposition of the MATa and MATalpha barcodes on the same chromosome. The two barcodes could be amplified by specific primers and subsequently sequenced simultaneously. d Ratios (mean ± sd) of diploids induced by the indicated peptide-TCR pairs to diploids induced by the negative control, the peptide-TAX 8* -TCR, in the YAMTAD library-on-library screening. The five peptides used for screening were mixed equally. Each experiment was performed with 4 technical repeats and was independently duplicated 3 times. The mean of 12 duplicates is shown. e Ratios (mean ± sd) of diploids induced by the indicated peptide-TCR pairs to diploids induced by the negative control, the peptide-3* -TCR, in the YAMTAD library-on-library screening. The SL9, 3 L, and TAX 8* peptides were mixed with the negative yeasts-3* and TAX at a 1:102 ratio. Each experiment was performed with at least 3 technical repeats and was independently duplicated twice. The mean of 7 replicates is shown. f Ratios (mean ± sd) of diploids induced by the indicated peptide-TCR pairs to diploids induced by the negative control, the peptide-3* -TCR, in the YAMTAD library-on-library screening. The SL9, 3 L, and TAX 8* peptides were mixed with the negative yeast- 3* and TAX at a 1:104 ratio. Each experiment was performed with at least 3 technical repeats and was independently duplicated twice. The mean of 7 replicates is shown. Unpaired two-tailed Student’s t-test was used for statistical analysis in a, d, e, f. ** indicates a two-tailed P value < 0.01. * indicates a two-tailed P value < 0.05.

