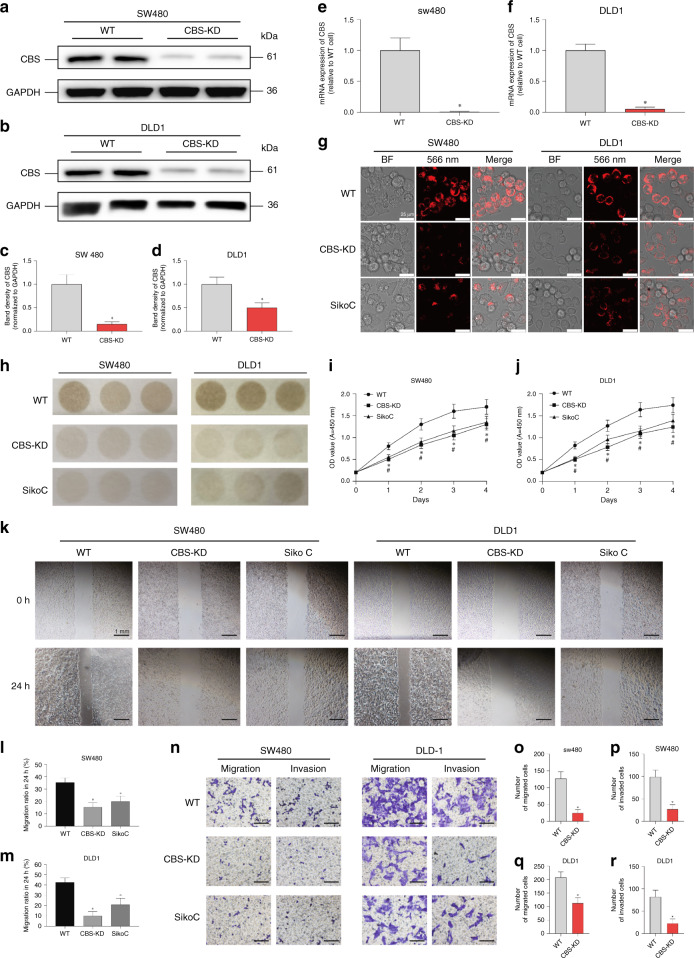
Fig. 1. Effects of CBS inhibition on H2S production, invasion and metastasis in SW480 and DLD1 cells.
a, b Representative western blot images of CBS in WT and CBS-KD SW480 cells and DLD1 cells. c, d Relative band density of CBS in western blot analysis. e, f mRNA expression levels in SW480 and DLD1 cells after CBS knockdown. g H2S levels in different groups of cells, as measured by the H2S probe. h H2S levels in different groups of cells, as measured by lead acetate test paper. Cells in the sikokianin C group were treated with 1 μM sikokianin C for 48 h, as described below. i, j Proliferation of WT cells treated with or without sikokianin C and proliferation of CBS-KD cells. k Representative images of the scratch in different groups of cells. l, m Migration rate of SW480 and DLD1 cells at the edge of scratches in different groups in the scratch assay. n Representative images of migration and invasion through the membrane of Transwell chambers in different groups of cells. o, p Analysis of the number of SW480 cells that passed through the Transwell chamber membrane during the migration and invasion assays. q, r Analysis of the number of DLD1 cells that passed through the Transwell chamber membrane during the migration and invasion assays. (n = 3, biological replicates) *P < 0.05 vs. the WT group. #P < 0.05 vs. the CBS-KD group.

