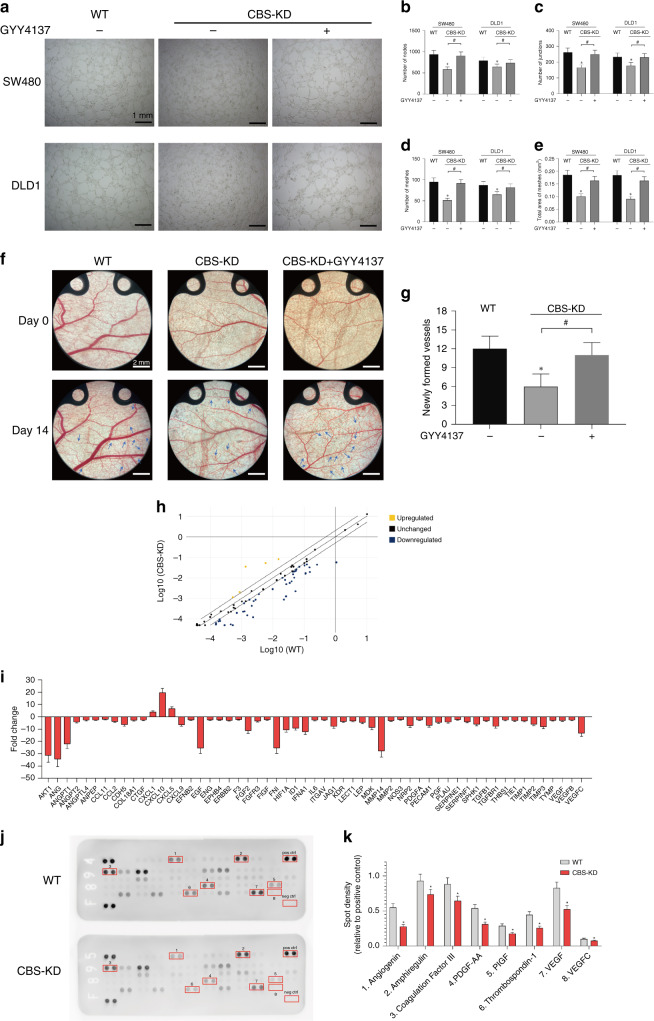
Fig. 2. Effect of CBS inhibition on angiogenesis of colon cancer cells.
a Representative images of HUVECs after coculture with WT or CBS-KD SW480 and DLD1 cells with or without GYY4137 treatment. b–e Average numbers of nodes, junctions and meshes and the area ratio of meshes formed by HUVECs in different groups. f Representative images of capillary formation in the dorsal skinfold chamber in different groups. g Average number of newly formed vessels in different groups at 14 days. h Scatter plot of the RT2 Profiler PCR Array analysis results. i Fold changes in the transcript levels of genes associated with angiogenesis between WT and CBS-KD SW480 cells. (Genes with a transcription fold change >2 or < −2 are shown). j Representative images of the Proteome Profiler Human Angiogenesis Array. Spots with significant differences are marked with red boxes. Pos ctrl indicates the positive control, and neg ctrl indicates the negative control. k The densities of spots with significant differences. (n = 3, biological replicates) *P < 0.05 vs. the control group. #P < 0.05 for the comparison between the two groups connected by brackets.

